Artículo Científico
Green Bonds: Quick Insight into One of the Most Implemented Sustainable Debt Instrument to Tackle Climate Change
BONOS VERDES: UNA RÁPIDA PERSPECTIVA SOBRE UNO DE LOS INSTRUMENTOS DE DEUDA SOSTENIBLE MÁS IMPLEMENTADOS PARA ENFRENTAR EL CAMBIO CLIMÁTICO
Green Bonds: Quick Insight into One of the Most Implemented Sustainable Debt Instrument to Tackle Climate Change
Ciencias Administrativas, núm. 21, 2023
Universidad Nacional de La Plata

Esta obra está bajo una Licencia Creative Commons Atribución-NoComercial-CompartirIgual 4.0 Internacional.
Recepción: 14 Abril 2022
Aprobación: 27 Septiembre 2022
Publicación: 31 Diciembre 2022
Abstract: The importance of climate change and its impacts on different areas has helped to increase the implementation of financial instruments that seek to mitigate or adapt future events. After Paris Agreement in 2015 a particular instrument started to gain momentum: Green Bonds are debt instruments which focus on financing only green projects and even when the need financial flows are higher than actual contributions, green bonds issuance has been breaking major milestones since 2007. Until June 2021, cumulative volume of green bonds was 1.6 trillion dollars, mostly coming from United States, China, and Europe. Countries are exposed to climate change risks despite its contribution to it however efforts from some regions such as Latin America or Africa are still very low. Also, an unorganized transition to a greener future could increase instability within prices, people, and natural resources.
Keywords: green bonds, sustainability, climate change.
Resumen: La importancia del cambio climático y sus impactos en diferentes áreas ha contribuido al incremento de la implementación de instrumentos financieros que buscan mitigar o adaptar a futuros eventos. Luego del acuerdo de Paris en 2015 un instrumento en particular gano inercia: Los bonos verdes son instrumentos de deuda con foco en financiar solo proyectos verdes y aun cuando la necesidad de flujos es mayor a la contribución actual, la emisión de bonos verdes a sobrepaso grandes logros desde 2007. Hasta junio 2021 el volumen acumulado de bonos verdes era de 1.6 mil millones de dólares, mayormente provenientes de Estados Unidos, China y Europa. Los países están expuestos a los riesgos del cambio climático independiente de su contribución al mismo, sin embargo, los esfuerzos de algunas regiones como la latinoamericana y africana son todavía bajos. También, una transición no organizada hacia un futuro más verde podría aumentar la inestabilidad en precios, personas y recursos naturales.
Palabras clave: bonos verdes, sustentabilidad, cambio climático.
Introduction
In recent years climate change, its impact, and the path to tackle it have become important topics on most agendas. For years humankind has made use of different resources (including natural) to create technologies and standards of living that are not environmentally friendly. Since the industrial revolution, these impacts have exponentially increased and that leads to what is known today as global warming and climate change. If not enough is done within the next 30 years, this scenario will have global and dramatic impacts on all forms of living within the next 80 years. Seeking a better future than the one proposed by experts in this topic demands a large amount of capital and a massive change of attitudes toward the environment. There are several different approaches that could help humanity to achieve a sustainable future: ESG factor from a point of view of companies’ behavior and labeled debts that help investors get economic revenue while helping the development of a greener economy. Particularly, green bonds, a fixed-income instrument specially designed to support green projects (also one type of labeled debt), is one of the most chosen instruments by investors who want to help build a sustainable economy. Since the adoption of the Paris Agreement at the Paris Climate Conference (COP21) in December 2015, financial instruments and especially green bonds have increased considerably.
The aim of this article is to describe and to make a short analysis of the green bond market. The focus of study of this article is on green bonds between 2007 and 2020 when the first one trillion was issued, then as a separate topic, year 2021, and the Latin America region with a short overview of Argentina.
Change within priorities
Risk perceptions have been changing within the years. In 2021, the Global Risk Report released by the World Economic Forum considered many environmental issues to be the top global risk in terms of likelihood and impact, it is interesting to notice that only one decade ago, environmental problems were not considered a major global risk. (World Economic Forum et al., 2021). The last two reports of the Intergovernmental Panel on Climate Change (IPCC, a body of the United Nations that provides data related to climate change and plays an important role by creating different kinds of reports) foresee a future where devastating events would impact life on earth if a significant action to address climate change does not occur.
Clearly, global warming and now climate change are going to be an important factor in day-to-day decision-making. Climate change threatens communities and all kinds of economies as it is seen as a risk to medicine (loss of potential drugs because of loss in biodiversity), to food production (extreme weather events), and to water supply (droughts) among others. This will particularly affect poor and developing countries, which may suffer from the same events, but do not have the resources to prevent or to recover from climate impacts.
It is relevant to mention that the stages in climate change dynamics could be discrete, which means that several small actions could trigger a major event at any time. Besides this, the first discreet event could make it easier to reach a second one. If these points (referred to as tipping points) are reached, irreversible and global impacts such as a sea level rise, extreme weather events, or destruction of entire ecosystems would be inevitable and capable of triggering a new one (like in Jenga or Domino) (Cho & Columbia Climate School, 2021).
Need of change
Since 1850 the average temperature of the earth´s surface has risen about 1.1° C mainly due to an increase in carbon dioxide concentration (which is closely related to human being activities such as burning fossil fuels). The nature of certain molecules creates a layer (similar to a glass in a greenhouse) that traps the heat from the sun and keeps it from leaving the atmosphere into space. The heat creates the global warming effect which indirectly causes climate change. Gases such as nitrous oxide or methane are also responsible for global warming and have more capacity to trap heat than carbon dioxide has (all three are considered greenhouse gases, GHG). To avoid a major impact and based on the analysis of cumulative GHG quantities over the years and on current science-based projections, the Paris Agreement proposed to halve global emissions by 2030.
New social trends led by younger generations take a lot of effort to solve these problems. They were raised in a world that understands the need to supply resources for greener alternatives before 2030.
National Determined Contributions
In 2015, when the Paris Agreement was adopted by 196 Parties at COP 21, each country's long-term goals to reduce national emissions were discussed. Each Party should prepare, communicate, and maintain successive and higher goals to achieve (National Determined Contributions or NDCs). NDCs should be submitted every five years (2020, 2025, 2030) and successive NDCs will have to progress compared to the previous ones and need to reflect the highest possible ambition.
To limit global warming to well below 2° C, but preferably to 1.5°C degrees Celsius (compared to pre-industrial levels) by 2100, the goal of the Paris Agreement and the contribution of each Party through its NDCs are essential. The Paris Agreement provides a framework for financial, technical, and capacity building support for all who need it. (United Nations Environment Programme, 2021). With current Nationally Determinate Contributions (NDCs) a global temperature of at least 2.7°C will be reached this century.
Focus on mitigation and adaptation through new kinds of finance
The Paris Agreement acknowledged the importance of finance in mitigation and adaptation. IPPC´s report points to a global shift to renewable energy generation and electrification as a central objective for climate finance.
The amount of investment needed for the next 10 to 30 years depends on which scenario humanity wishes to live in. The UN Environmental Programme estimates that the cost of adaptation only in developing countries ranges from 140 billion to 300 billion per year by 2030 and from 280 billion to 500 billion a year by 2050 (United Nations, 2021a). Morgan Stanley’s report estimates a 50 trillion-dollar investment in five key areas to stop climate change by 2050 (Klebnikov, 2019). According to the World Bank, around USD 90 trillion is needed by 2030 in infrastructure to limit global warming by 1.5 °C relative to pre-industrial levels. This transition would provide a 4-dollar benefit per each dollar invested and implementation towards carbon neutrality before 2050 (United Nations, 2021b).
Climate transition could also present growth opportunities for developing countries such as India which announced that by 2070 will become net-zero, being today one of the world´s largest carbon emitters. This action could create over 50 million jobs and boost India´s economy. The investment includes adaptation to floods or technologies that could improve crop yields in drought conditions (Laidlaw, 2021).
Importance of planning and timing
A transition towards a green economy means taking climate risks and opportunities into account in all financial and policy decisions. This could mean to abandon fossil fuels subsidies and to end investment in brown sectors which may cause instability in terms of work, prices, and supply. The path towards a net-zero economy needs not only investment but also strategy, planning and timing. Renewable energy prices have dropped far more quickly than what the industry projected, which brought problems to investors and their rate of return (annual solar energy prices were forecast on average to fall 2.6% during the last decade, but they went down 15%). This could mean billions per year in savings with each improvement within technology and production (although some processes and industries related to the brown sector will suffer closing or a reduction in demand). But the pressure that governments need to apply to guide different areas through a path of greener energies can have and have already had an impact over industries that depend highly on electricity and therefore suffer a non-organized transition (United Nations, 2021).
Analyzing the price of different sources: The cost of electricity from coal only fell 2% while solar energy fell 89% and wind energy 70%. This shows investments, improvements, and interest in clean energies rather than conventional ones (Wood, 2021). According to this, when some big events happen, such as the war between Russia and Ukraine (which showed the European Union how dependent on other´s energy they were), or the impact that COVID-19 had on all kind of economies (when isolation created a disruption in terms of product transport), a need to risk management arises and therefore a path to energy independence or diversification increases that can be accomplished with green energy investments. In 2020 emerging markets continued to lead global energy transition, with no less than 70% of all new renewable power capacity installed there. In some countries, solar and wind are the lowest-cost options for new generation (BloombergNEF et al., 2021).
Russia´s economy (which has 40% of its federal budget coming from oil and gas) like other economies based on fossil fuels, may suffer the impacts of an inefficient energy transition if not prepared. On the contrary, in 2020 Germany had 36.5% of energy coming from fossil fuels, 50.5% from renewable and 13% from nuclear energy (Braun et al., 2022). Mankind will suffer major losses if countries fail to understand the need for the transition of certain activities and the adaptation their economies need to accomplish.
Sustainable instruments
Labeled debt markets provide a framework that has been improving within the last 2 decades. This helps investment to scale up towards the steps that would give humanity a chance to avoid most of the impacts of climate change.
The Green, Social, and Sustainability bonds market in 2019 was 323 billion but that annual emission is still a small portion of the total market, representing 4.5 % of total global bond issuance in 2019 or 3% in 2018 (Whieldon, 2020).
The change in stakeholders, investors, and society´s priorities lead to a growing market of sustainable debts which at the end of 2021 had recorded a cumulative volume of 2.8 trillion dollars (2007-2021) (1.6 trillion green bonds, 520 billion sustainability bonds, 538 billion social bonds, 135 billion SLB and 9.6 billion transition bonds). Only in 2021 Climate Bonds capture GSS+ (Green, Social, Sustainability, Suitability-linked bonds, and transition) debt for almost USD 1.1 trillion (September was the busiest month for GSS+ debt within volumes of 152.4 billion). However, government subsidies to fossil fuels reached USD 11 million every minute showing a clear inconsistency in world financial targets and capital flow (Climate Bond Initiative, 2022).
Analyzing the distribution within sustainable debt, green bonds represent a big contribution (with almost 50%) of the total volume. However, dynamics of growth in labeled debt markets have started to change in 2019 when sustainability bonds increased rapidly (in 2020 social bonds were triggered by the COVID-19 pandemic). In 2021, SLB had the fastest growth with a 10 times YoY (year-on-year) expansion, but volumes still benefited green bonds.
Green bonds
Green bonds are financial instruments that finance green projects (as a social bonds finance social projects) and provide investors with regular and fixed income payments (as vanilla bonds). From a technical point of view, green bonds are not different from other types of bonds. Among other features, they have a rate of interest, need rating agencies and deliver a coupon.
Green bonds have kept a trend of 10-year-trend of market expansion. The highest annual issuance was in 2021, with more than half a trillion dollars (517.4 billion). The last 5 years average growth rate of expansion was 54% and September 2021 the most prolific month in the green bond market history (USD 86 billion volume issuance). Lack of standardization still represents a problem for investors who look for improvements in the framework. However, this scenario did not stop the 75% increase in the size of the market from 2020 to 2021, which was a contribution of more issuers, instruments, size, and countries. Not only has green debt increased but almost all categories have had the same behavior (leaving only social bonds with negative YoY). The first bond was issued in 2007 from multilateral institutions such as European Investment Bank (EIB) and World Bank but since 2014, the market has experienced a swift growth in its dynamics with yearly breaking records.
Green bonds have additional transaction cost because issuers must be transparent on “use of proceeds”. However, benefits come from highlighting green assets, positive marketing, investor diversification, and tackling environmental concerns, among others.
Market dynamics
From 2007 to 2020, the average annual growth rate in green bond issuance was 95%. The first green bond ever issuance was in 2007 by the European Investment Bank for 807.2 million dollars, and by 2015 green bond markets hit the 1 billion cumulative issuances. Five years later, in December 2020, cumulative issuance reached the milestone of 1 trillion dollars.
During that period, the top three investments were in the energy sector (USD 375 billion), followed by low carbon buildings (USD 263 billion) and Transport (USD 190 billion). Water, Land Use, and Waste represent 17% of the use of proceeds. Europe is the region with the largest green bond issuance (USD 432 billion) followed by North America (USD 237 billion) and the Asia-Pacific region (USD 219 billion), only 2 % came from Latin America and the Caribbean and USD 3.5 billion from Africa.
Almost 73% of the first trillion dollars were concentrated within 10 countries. Top 3 have issued USD 454 billion in total (Table 1).
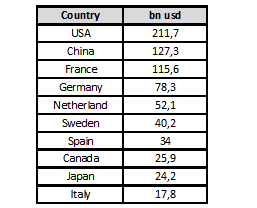
Note: Own elaboration with data from Climate Bond Initiative (Jones, 2020).
Concentration is not only seen in countries but also in the currency where 40% of all green bond issuance is in Euro, 35% in Dollars, and 8% in Yuan.
Financial corporations are the largest participants within green issuance with USD 205 billion, followed by non-financial corporations with USD 205 billion and developing banks with USD 158.8 billion.
Developed markets dominated green bonds issuance (72%) leaving emerging markets with less than a fifth of issuance (19%) (Jones, 2020).
Over the last five years, the green debt market has increased exponentially to a growth rate of over 50% from 2017. Green debt market passed from a cumulative total of USD 104 billion in 2015 to an annual issuance of more than USD 100 billion in 2017. At the end of 2020, the market surpassed the cumulative 1trillion milestone and a year later was 50% more. This trajectory could land to a trillion per year milestone, to a cumulative sum of USD 5 trillion by 2025 (Jones, 2022).
Dynamics in 2021
The average size of green bonds in 2021 was 47% more than in 2020 (from 170 million to 250 million), consistent with the previous year’s trends. Issuers still prefer hard currency to reach international diversification. (82% of issuance is concentrated in EUR, USD, and RMB)
In 2021 USA, China, and Germany were the top 3 green bond issuers. The increase in USA's volumes is notorious (from 50.3 billion in 2020 to 81.9 billion in 2021) representing a 63% YoY. The cumulative total in the USA case stands at USD 304 billion which is 50% larger than China's (which comes in second place). The USA green market in Q1 was the strongest. The deals value was 23.2 billion (with a 208% YoY increase) despite the inevitable signaling of a rate increase of the Federal Reserve Bank (FED).
Energy, Building, and Transport are still among the most chosen categories to invest in. In 2021 this represented 80% of all issuances. Although all categories have presented growth, Industry was the category that presented the larger YoY growth with an 824% increase. Some issuers prefer to support special categories: non-financial corporates support 40% of Energy and 27% of Total Transport Capital, while financial corporates support 37% of Buildings. The industry had strong support from sovereign deals from the UK, Serbia, Hong Kong and the EU green Bond.
Even when half of the green bond volumes were issued in Europe, almost 75% were from developed markets with considerable growth from development banks, financial and non-financial corporate issuers, especially the last one with a 278% increase in emerging markets. Green bond issuance in the Asia-Pacific region was 129% higher than the previous year followed by Supranational issuers with a 102% increased. China, Japan, and Singapore were top on the list with 70% of the total volume within the region. Volumes from Latin America and Caribbean (LAC) region were lower in 2021 (compared to 2020) with issuers emitting USD 8.2 billion from a total of USD 522.7 billion (Climate Bond Initiative, 2022). However, within the region green bond issuance grew from USD 13.6 billion to 30.2 billion (September 2019 to June 2021) (Climate Bond Initiative, 2021a)
Latin America
Green bonds in the region doubled in less than two years, growing from USD 13.6 billion in September 2019 to USD 30.2 billion at the end of June 2021 mostly supported by sovereign issuance from the Republic of Chile (USD 3.8 billion) and several issuers from Brazil (USD 2.5 billion).
Chile (36.6%), Brazil (24.1%), and Mexico (16%) are the top three countries in terms of GSS (Green, Social, and Sustainability) debt and concentrate up to 77% of issuance in the LAC region. From that, green bonds represent the largest share of the market with 62% of the total. Brazil is the region´s largest green bond market with 10.3 billion (33.7% of the total), followed by Chile (USD 9.5 billion) and Mexico (USD 4 billion). In addition to this, Chile is the region´s largest social and sustainability bond market with USD 8.3 billion followed by Mexico (USD 3.7 billion) (Figure 1).
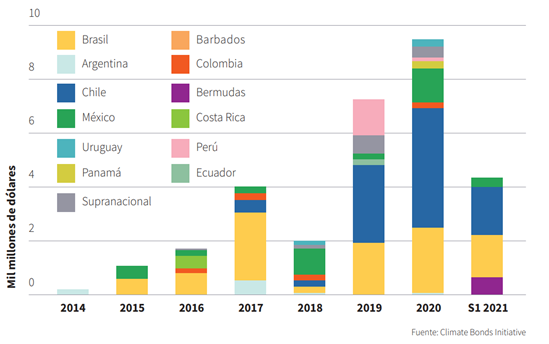
Green bonds volume issuance in Latin America as at June 2021 (Page 6, Climate Bond Initiative, 2021b)
An increasing number of issuers explain the development of LAC green market in recent years. Since 2020, 25 new issuers have entered the market. Most of them are corporations from Brazil, and the number of countries that participate in the green bond market increased from 8 to 12 in 2019.
As of June 2021, Chile was the only country in LAC that had issued sovereign green debt. Public sector issuance in general is lower than in corporate. Chile plays a major role in the case of LAC and represents almost 80% of all issuances. Non-financial corporates (39%) and sovereign (25%) issuers prevail and lead the market thanks to the issuance in Brazil and Chile. Brazil and Mexico are the countries with more diversification in terms of the type of issuer, opposite to Barbados, Panama, Peru, and Uruguay where most of the issuance was made by non-financial corporates. Financial corporates were rapidly increasing with an annual record in 2020 (USD 900 million) which has already been exceeded in the first half of 2021.
Different from global tendencies, LAC has invested 12% of all green bonds in Land Use and has a minor contribution to Buildings (6%). Energy and Transport keep the global tendency with 44% and 28% respectively. However, allocations in Land Use have not crossed the USD 1 billion mark despite the volumes the region handles. Most public sector allocations tend to be in Energy while the private sector has a more diversified portfolio (but the proportions in energy tend to increase). The amount allocated to Energy has more than doubled compared to 2019 (from USD5.5 billion to USD 13.2 billion) and 2020 was the most successful year for this category.
Compare with other years, LAC is increasing the use of local currencies but still is a low proportion compared to USD and EUR. Brazil´s currency issuances have almost equal issuances in EUR in terms of individual deals. In 2019 it increased in the overall diversity of currency issuance. After the issuance of multiple small green bonds, the average and median bonds have fallen by 26% and 40% but this represents a signal of opportunity to small companies or other types of issuers.
Focusing on the three major players of the regional market: Chile has 72% of its allocation in Transport, followed by 14% in Energy with a cumulative amount issued of USD 9.5 billion, Brazil has 50% in Energy, 25% in Land Use, and 10% in transport with a cumulative amount issued of 10.3 billion and Mexico has 82% in renewable energy and 7% in Transport with a cumulative amount issued of USD 4 billion (Climate Bond Initiative, 2021b).
Argentina
Greenhouse gas emissions per capita in Argentina are slightly above G20 average and above most countries in Latin America (Our World in Data, 2022a). Even when Argentina represents only 0.6% of all GHG emissions, its NDCs are far away from being compatible with Paris´s Agreement suggestions. A considerable part of Argentina´s GHG emissions come from Agriculture (Our World in Data, 2022) and this sector plays an important role in the country’s economy.
It is important to consider that the impacts on a particular country are not related to the amount of GHG emissions that that country has made but to the amount of GHG emissions from the world. On the contrary, the type of impact, its intensity and the risk associated with climate change depend on the region and the vulnerability of each country.
The dependence on countries upon natural resources or primary activities could represent a major problem in the future if adaptation or mitigation is not made correctly or in time. In the case of Argentina, Stanford web shows that the likelihood of losing GDP because of the impact of climate change is almost secure, with a 95% likelihood of losing more than 20% GDP and 57% likelihood of losing more than 50% GDP by 2100 (Burke et al., 2015). In other words, the impacts that Argentina would suffer represent a major concern for its habitants, institutions, and all stakeholders.
According to the Climate Bond Initiative (CBI), between 2017 and June 2021 Argentina´s sustainable finance market reached a cumulative USD 1.3 billion (2.7% from a GSS total market of USD 48.6 billion). Green bonds represent 58% and sustainability bonds a 34%. A 68% of the total cumulative issue volume comes from local governments. Most of the issuance (85%) is in USD. The country has also a diversified type of issuers where (considering GSS) 10 issuers are responsible for 13 issuances. Almost half of them are from non-financial corporates (42%) and an average instrument size of USD 97 million.
In 2019 Argentinian banks signed a Sustainable Finance Protocol which seeks a sustainable finance strategy in the banking industry. The same year the country became a member of the Coalition of Finance Minister of Climate (Climate Bond Initiative, 2021b). This shows that even when the country has not played an active role concerning climate change (as other countries have done within the region), it does tend to take actions. Argentina also has a sustainability index in BYMA where important companies such as BBVA, Banco Macro, Central Puerto, Holcim, Pampa Energia, YPF and Tranportadora de Gas del Sur are listed. Bolsas y Mercados Argentinos´s Index (BYMA´s index) has a global benchmark: The Down Jones Sustainability Index, which includes the top 10% of the 2,500 largest companies in the S&P Global BMI, based on environmental and social concerns.
In BYMA´s web page (Bolsas y Mercados Argentinos, 2022) you can see how important green bonds in Argentina´s labeled market are (85%), followed by sustainable bonds (11% with a single contributor: Laboratorios Richmond) (Figure 2) and the low participation of social bonds.
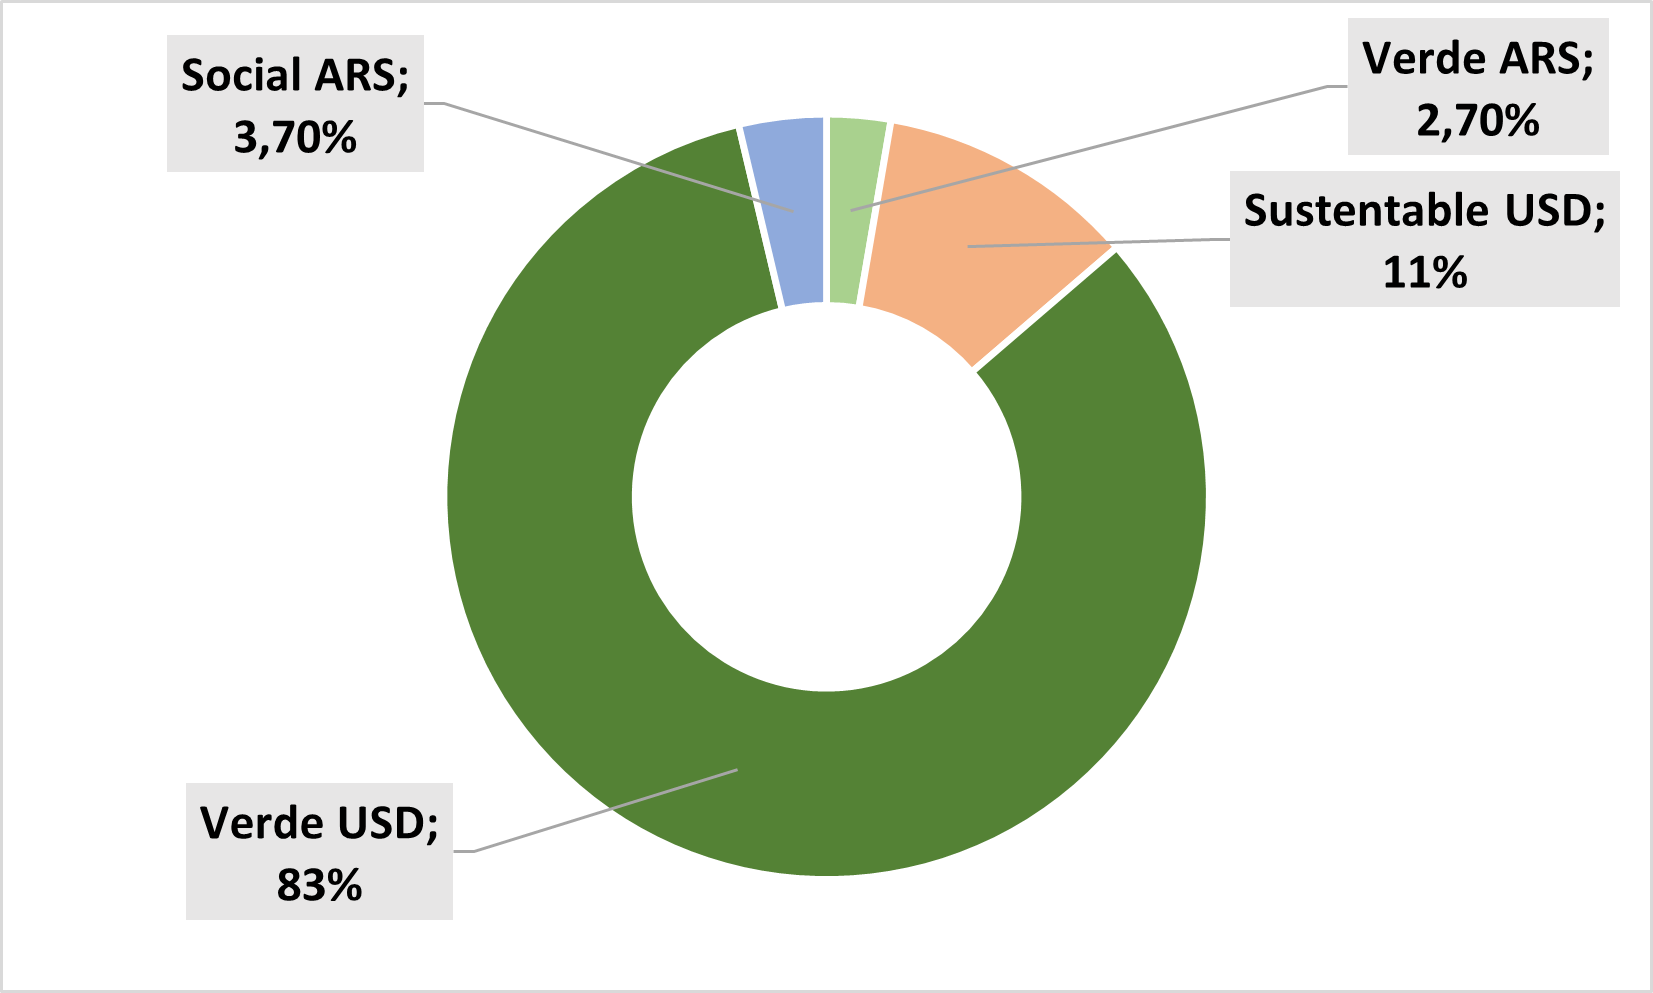
Own elaboration from Bolsas y Mercados Argentinos data (2022) up to 26.04.2022. Bonds issued in pesos were converted using value of dollar MEP from that date.
Genneia, a referent in the renewable energy sector in Argentina has been a major contributor to its green debt market. In Argentina, non-financial corporate in recent years (Table 2). In Argentina´s case, non-financial corporates. In fact, Mexico and Argentina were the only countries with local governments issuance as of June 2021 (province of Jujuy, La Rioja, and Mexico City).
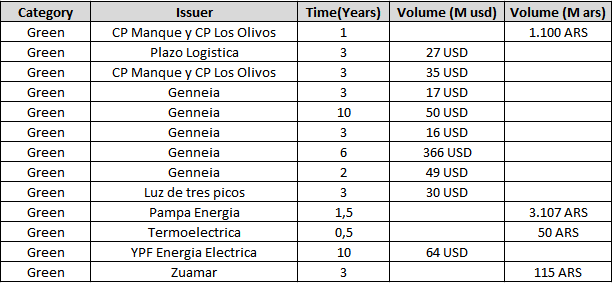
Note: Own elaboration from data from Bolsas y Mercados Argentinos(2022)
Conclusion
The green bond market is showing major adoption among investors and growth in several countries. Projections estimate trillions of dollars in issuance per year within the next decade but also critical scenarios if mitigation if mitigation and adaptation is not massively adopted.
For those countries where adaptation has not been a priority, a scenario where mitigation has not been fully achieved would be a huge risk. Above this, developing countries or those that lack the financial resources to recover after climate impacts will experience an increase in the gap that separates their economies from developed countries. In particular, Africa and Latin America will suffer the most if no change takes place. These regions present low volume in terms of emissions, but lot of renewable energy potential.
The predominance of hard currencies in green bond issuance shows a need for integration into an international debt market. This could be a problem for those who have instability in their own currency or lack the framework to generate trust among international investors.
The growth in green bond issuance in recent years illustrates the importance of achieving a greener economy, but projections still show that much more needs to be done. If countries do not achieve rapid neutrality in terms of GHG emission (it is not about reaching the goal but also about timing), it is certain that life on earth will experience catastrophic and unprecedented events.
Over the next 10 to 30 years, significant financial flows to mitigation and adaptation must occur. Achieving a net-zero economy could reduce the impact of climate change, but it is rather difficult to imagine a future without any kind of impact. There is still much to do to reduce the probability of failure. Volume towards green market, although much higher than a couple of years ago, is still insufficient and it is highly concentrated in some countries. Latin America holds over half of all green debt issuances within two countries. Australia (even when it has some good solar Energy policies) or India still depends highly on fossil fuels. Argentina has a minor representation in labeled markets and has a huge potential in zones where solar irradiation is high (something that Chile understood very well within its country).
For future reports, regional-based analysis may be a good starting point to understand the best way to prepare our societies and economies for the impacts of climate change.
Even when green bonds represent nearly half the volume of sustainable markets, they are clearly not the only instruments designed to achieve climate change. The study and understanding of other financial instruments are an important issue, but not considered in this article.
References
Bolsas y Mercados Argentinos. (2022). Bonos Sociales, Verdes y Sustentables. Retrieved May 10, 2022, from https://www.byma.com.ar/productos/bonos-svs/
Braun, S.(2022, March 4). Will war fast-track the energy transition? DW. Retrieved May 10, 2022, from https://www.dw.com/en/will-war-fast-track-the-energy-transition/a-61021440
Demôro, L., Maia, S., & Aminoff, F. (2021, December 14). Climatescope 2021. Energy Transition Factbook. BloombergNEF. Retrieved May 14, 2022, from https://global-climatescope.org/downloads/climatescope-2021-report.pdf
Burke, M., Hsiang, S. M., & Miguel, E. (2015, October 21). LETTER - Global non-linear effect of temperature on economic production. Stanford University. Retrieved May 10, 2022, from https://web.stanford.edu/~mburke/climate/BurkeHsiangMiguel2015.pdf
Cho, R., & Columbia Climate School. (2021, November 11). How Close Are We to Climate Tipping Points? State of the Planet. Retrieved May 10, 2022, from https://news.climate.columbia.edu/2021/11/11/how-close-are-we-to-climate-tipping-points/
Climate Bond Initiative. (2021a, September 21). Latin America & Caribbean State of the market. Retrieved May 10, 2022, from https://www.climatebonds.net/files/reports/cbi_lac_2020_04e.pdf
Climate Bond Initiative. (2021b, September 22). Climate Bonds Initiative releases its latest report for Latin America and Caribbean (LAC) market. Retrieved May 10, 2022, from https://www.climatebonds.net/resources/press-releases/2021/09/climate-bonds-initiative-releases-its-latest-report-latin-america
Climate Bond Initiative. (2022, April 19). Sustainable Debt Global State of the Market 2021. Retrieved May 10, 2022, from https://www.climatebonds.net/resources/reports/sustainable-debt-global-state-market-2021
Jones, L. (2020, December 15). $1Trillion Mark Reached in Global Cumulative Green Issuance: Climate Bonds Data Intelligence Reports: Latest Figures. Climate Bonds Initiative. Retrieved May 10, 2022, from https://www.climatebonds.net/2020/12/1trillion-mark-reached-global-cumulative-green-issuance-climate-bonds-data-intelligence
Jones, L. (2022, January 31). $500billion Green Issuance 2021: social and sustainable acceleration: Annual green $1trillion in sight: Market expansion forecasts for 2022 and 2025. Climate Bonds Initiative. Retrieved May 10, 2022, from https://www.climatebonds.net/2022/01/500bn-green-issuance-2021-social-and-sustainable-acceleration-annual-green-1tn-sight-market
Klebnikov, S. (2019, October 24). Stopping Global Warming Will Cost $50 Trillion: Morgan Stanley Report. Forbes. https://www.forbes.com/sites/sergeiklebnikov/2019/10/24/stopping-global-warming-will-cost-50-trillion-morgan-stanley-report/?sh=7423013751e2
Laidlaw, J. (2021, November 12). On one end, trillions of dollars to invest in climate. On the other, huge and urgent need. How do we connect the dots? S&P Global. Retrieved May 10, 2022, from https://www.spglobal.com/esg/insights/on-one-end-trillions-of-dollars-to-invest-in-climate-on-the-other-huge-and-urgent-need-how-do-we-connect-the-dots
Our World in Data. (2022, February 16). Greenhouse gas emissions by sector, Argentina. ourworldindata.org. Retrieved May 10, 2022, from https://ourworldindata.org/grapher/ghg-emissions-by-sector?time=latest&country=~ARG
Our World in Data. (2022, February 16). Per capita greenhouse gas emissions, 2018. https://ourworldindata.org/. Retrieved May 10, 2022, from https://ourworldindata.org/grapher/per-capita-ghg-emissions
United Nations. (2021a). Financing Climate Action. United Nation-Climate Action. Retrieved May 10, 2022, from https://www.un.org/en/climatechange/raising-ambition/climate-finance
United Nations. (2021b, June 27). The trillion dollar climate finance challenge (and opportunity). UN News. Retrieved May 10, 2022, from https://news.un.org/en/story/2021/06/1094762
United Nations Environment Programme. (2021, October 26). The Heat Is On. A world of climate promises not yet delivered. Retrieved May 10, 2022, from https://wedocs.unep.org/bitstream/handle/20.500.11822/36991/EGR21_ESEN.pdf
Whieldon, E. (2020, Febreuary 3). Moody's predicts green, sustainable bond market will hit record $400B in 2020. Retrieved May 10, 2022, from https://www.spglobal.com/marketintelligence/en/news-insights/latest-news-headlines/moody-s-predicts-green-sustainable-bond-market-will-hit-record-400b-in-2020-56919081
World Economic Forum, McLennan, Zurich Insurance Group, & SK Group. (2021, January 12). The Global Risks Report 2021. Retrieved May 10, 2022, from https://www3.weforum.org/docs/WEF_The_Global_Risks_Report_2021.pdf
Wood, J. (2021, October 18). Renewable energy is cheaper than previously thought, says a new report - and could be a gamechanger in the climate change battle. The World Economic Forum. Retrieved May 10, 2022, from https://www.weforum.org/agenda/2021/10/how-cheap-can-renewable-energy-get/
Información adicional
Clasificación JEL: Q01