Artículo científico
ECUADORIAN FLOWER EXPORTS AND THEIR SEASONALITY: AN ECONOMETRIC ANALYSIS USING GARCH MODELING
EXPORTACIONES DE FLORES ECUATORIANAS Y SU ESTACIONALIDAD: UN ANÁLISIS ECONOMÉTRICO UTILIZANDO MODELOS GARCH
ECUADORIAN FLOWER EXPORTS AND THEIR SEASONALITY: AN ECONOMETRIC ANALYSIS USING GARCH MODELING
Ciencias Administrativas, núm. 25, 2025
Universidad Nacional de La Plata

Esta obra está bajo una Licencia Creative Commons Atribución-NoComercial-CompartirIgual 4.0 Internacional.
Recepción: 04 Noviembre 2022
Aprobación: 28 Diciembre 2023
Publicación: 31 Diciembre 2024
Abstract: Exports of natural flowers as macroeconomic variables present repetitive behaviors or patterns; the objective of this research is to obtain a GARCH econometric model of the seasonal behavior of Ecuadorian flowers in the international market. The applied methodology was descriptive with a mixed approach and quantitative approach to a total of 259 monthly data from January 2000 to July 2022. For this study, the Box - Jenkins or seasonal ARIMA time series methodology known as SARIMA (Seasonal Autoregressive Integrated Moving Average Model) was used with the Eviews 9 program. The results showed that the application of a GARCH model to a seasonal model was adequate to forecast five out-of-sample data after generating a first difference to the original model because it was not stationary, the peak export months are February, March, and May, respectively; the first because there is a significant boom every year as a result of the fact that in this month the day of love and friendship is celebrated and orders worldwide multiply, and the third for Mother's Day.
Keywords: econometrics, Ecuador, exports, natural flowers, seasonality, SARIMA model, GARCH model.
Resumen: Las exportaciones de flores naturales como variable macroeconómica presentan comportamientos o patrones repetitivos, el objetivo de esta investigación es obtener un modelo econométrico GARCH del comportamiento estacional de las flores ecuatorianas en el mercado internacional. La metodología aplicada fue descriptiva con enfoque mixto y énfasis cuantitativo a un total de 259 datos mensuales desde enero del año 2000 hasta julio del año 2022. Para este estudio se utilizó la metodología de series de tiempo Box – Jenkins o ARIMA estacional conocida como SARIMA (Seasonal Autoregressive Integrated Moving Average Model) mediante el programa Eviews 9. Los resultados demostraron que la aplicación de un modelo GARCH a uno estacional fue adecuado para pronosticar cinco datos fuera de la muestra luego de generar una primera diferencia al modelo original por no ser estacionario y donde se aprecia que los meses donde alcanza la cima de exportaciones son de febrero, marzo y mayo respectivamente; siendo el primero porque existe un auge importante cada año producto de que en este mes se celebra el día del amor y la amistad y los pedidos a nivel mundial se multiplican y el tercero por el día de la madre.
Palabras clave: econometría, Ecuador, estacionalidad, exportaciones, flores naturales, modelo SARIMA, modelo GARCH.
Introduction
At the beginning of the 19th century, David Ricardo (1950/1993)specified the participation of economies in the international context and the benefits through their specialization in those goods that present comparative advantages, which in the Ecuadorian context is beneficial due to thegeographic location for flower production (Moreno et al., 2016); therefore, an economy with a favorable trade balance helps economic growth (Zack & Dalle, 2015, as cited in Aguilar et al., 2020). Consequently, it is important to analyze exports, because according to Gladys Mireya Valero Córdoba et al. (2016), they represent the capacity of an economy to produce goods that will cross national borders to satisfy the needs of international economies and are related to what José Elías Durán Lima and Mariano Álvarez (2008) consider exports are the sales of goods and services by residents of one economy to others from another economy and thatthey are equivalent to the production not consumed in the country.
Ecuador, in particular, has great natural resources such as bananas, cocoa, shrimp, flowers, etc., and some of them have experienced important booms1 throughout the country's agroeconomic history (Cedillo Villavicencio et al., 2021). However, these goods are seasonal and respond to certain characteristics of the national and international market for their commercialization.
To model and forecast the behavior of a variable such as exports, there are several methodologies, each one being more rigorous than the other and crucial for econometric analysis. In this particular case, the one based on the historical behavior of the export variable was chosen, its level of volatility and its period of seasonality, using Generalized AutoRegressive Conditional Heteroscedasticity (GARCH), which is part of the family of ARCH models that use maximum likelihood estimation of parameters (Espinosa Acuña & Vaca González, 2017).
The seasonality condition allows identifying certain patterns that are repetitive for some variables such as exports (X) of natural flowers, toy sales, seasonal illnesses due to climate changes, etc. The flowers of Ecuador are among the best in the world. Their characteristics are mainly: thick stems and large extension, large buds and bright colors. In addition, the great distinguishing feature of the Ecuadorian rose is its long vase life after cutting (Subgerencia de Análisis e Información, 2017). Among the varieties are: Gypsophila, carnation, roses, lilies, and others. According to the National Institute of Statistics and Census, according to the International Standard Industrial Classification, flowers fall under code A0119.03 “Growing of flowers” ¿, including the production of cut flowers and flower buds (Instituto Nacional de Estadísticas y Censos [INEC], 2012). This classification is used by the Central Bank of Ecuador to prepare the statistics used in this research (Banco Central del Ecuador [BCE], n.d.).
According to the National Finance Corporation, in 2017 there were 204 companies whose economic activity was the cultivation of flowers, located mostly in Pichincha with 77%. In 2018, of the 208 companies, 74% were also located in this same province. In 2019, of the 181 companies registered with the Superintendence of Companies, 74% remained in Pichincha, and according to 2020, of the 237 companies, 73% continued their economic activity in Pichincha, followed by Cotopaxi as the most representative (Subgerencia de Análisis e Información, 2017). The industrialization process of this sector demands important sources of economic resources and, as we have seen, there is a high concentration of companies in the highlands due to the high (Henao et al., 2022) of companies in the highlands due to climatic conditions and irrigation water (Mena Vásconez et al., 2017). Table 1 below shows the classification of the companies dedicated to this activity:
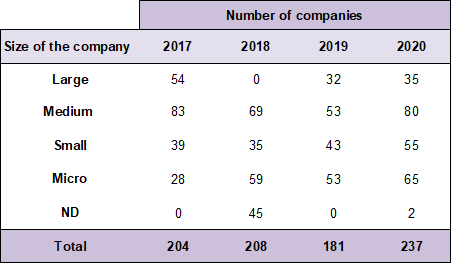
Source: Subgerencia de Análisis e Información (2018), Subgerencia de Análisis de Productos y Servicios (2019, 2020, 2021). Prepared by: Authors
As shown in Table 2, in the last four years, the highest number of employees was recorded in year 2018 with 33,494 people employed in the flower sector, followed by 29,867 in 2017, 28,775 in 2020, and 25,177 in 2019.
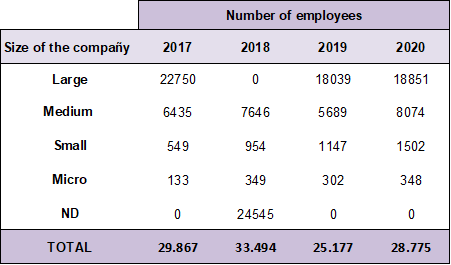
Source: Subgerencia de Análisis e Información (2018), Subgerencia de Análisis de Productos y Servicios (2019, 2020, 2021) .
With respect to production and harvested area, their evolution over the last five years can be seen in Illustration 1 below, taking into account that the rose is the most sold species in the local and international market.
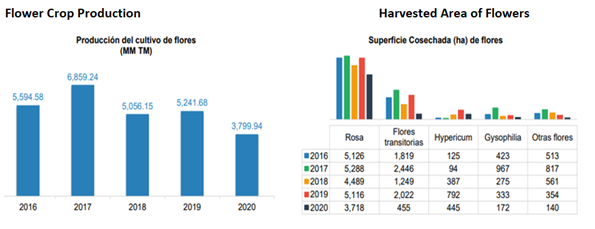
Source: Subgerencia de Análisis e Información (2018), Subgerencia de Análisis de Productos y Servicios (2019, 2020, 2021)
Flowers are a non-traditional export product for Ecuador2, whose figures for the last 13 years, including the current year 2022, are shown in Illustration 2, which highlights that in 2021 they grew by 12% compared to 2020, when flower exports fell to $827,142.1 as a result of the decrease in demand for many exportable products due to the effects of the COVID-19 pandemic3.
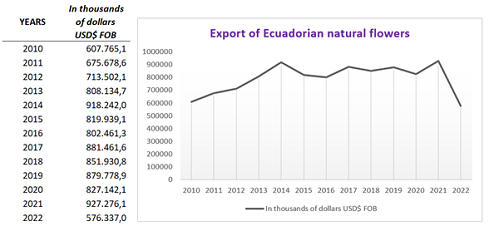
Source: BCE: annual statistics. Prepared by: Authors
The main destinations of Ecuadorian exports in 2021 were: United States with 37%, Russia with 14%, Holland with 10%, Ukraine and Italy with 3%, Canada with 4% and the rest of the world with 29%, (Subgerencia de Análisis de Productos y Servicios, 2021) therefore, the trade balance for this product is favorable, including the year 2020, which was $827 thousand dollars FOB due to the limited import of flowers from the world. With respect to imports (M) to the year 2019 there was a highly significant value in its historical evolution, reaching $255,036.85 FOB imports, being the countries of Colombia with 99% and China with 1% respectively the countries of origin to the years 2020 and 2021. The financing received by this sector comes in 93% from Private Banks and 7% from the Public; the latter, through the National Finance Corporation mostly in the province of Pichincha with 56%, followed by Cotopaxi, Imbabura, Carchi and Cañar with 16%, 14%, 8% and 6% respectively between 2018 and 2021 (Subgerencia de Análisis de Productos y Servicios, 2021).
Finally, the article is structured as follows: a section with an introduction on the importance of the analysis of the Ecuadorian export sector, the next section contains the GARCH methodology applied to the historical series extracted from the Central Bank of Ecuador. Also; in the results section the calculated seasonal model and the stationarity tests are shown, in the discussion section some studies related to the floriculture sector and finally the section on conclusions and recommendations for future research related to the prediction of economic variables.
Justification
It is important for students, teachers and the scientific community to analyze the behavior of a seasonal economic variable such as exports of Ecuadorian natural flowers, since it allows us to study, analyze and understand its cyclical component related to international demand, especially in the months of February and May of each year while in the rest of the months exports fluctuate, an essential condition of the GARCH volatility models, which at a macroeconomic level allow the construction of scenarios based on public policies of incentives or benefits for economic sectors that boost the economy between them the agricultural one.
The practical application of this type of models is reflected in several disciplines; for example, Olga Formigoni Carvalho Walter et al. (2013) analyzed the influence of prices on motorcycle sales using a SARIMA forecast model (1,0,1) (2,1,0)12. On the other hand, Juan Tudela Mamani et al. (2022) studied the demand for tourists to Peru, through a seasonal ARIMA model, with characteristics (1,1,1) (0,1,1)12 that captured the cyclical essence of tourism for decision making as well as that Thushara et al. (2019) who agreed that tourism in Sri Lanka has grown, generating foreign exchange and employment, the prediction of which was possible through the use of a SARIMA model (3,1,3) (2,1,2)12. For their part, Wanderson de Paula Pinto et al. (2015), in their study on the flow of the Doce River and its seasonal behavior, obtained a SARIMA model (1,1,1) (1,1,2)12 for the management of the Municipality of Colatina in the prevention of possible natural disasters. Regarding the application in the agricultural sector of Submedio the Valley of São Francisco River in Brazil, on the export of mango, the price of this fruit could be related through a SARIMA model (4,1,1) (0, 1,3)2 of biannual seasonality for the determination of public policies related to subsidies to producers (Lima et al., 2013). Concerning the environment, Claudionor Ribeiro da Silva et al. (2018), carried out a study on the recovery forecasts of Caatinga and vegetation areas in the Serra das Capivaras National Park in the state of Piauí - Brazil for the conservation of the biome and determined a SARIMA model (1,2,2) (0,1,2)12 for making decisions aimed at protecting natural areas.
In this sense, there are international studies analyzing the statistical behavior of this variable. However, the econometric background in Ecuador related to the use of the GARCH methodology is limited and not necessarily oriented to the flower sector, which highlights the importance of this research.
Objective
To build an econometric model of the seasonal behavior of Ecuadorian natural flower exports to the international market using the GARCH methodology to predict economic scenarios that can inform public and private decision-making related to foreign policy.
Methodology
The research was descriptive and used a mixed approach, where the quantitative analysis was based on the Box - Jenkins (1970) methodology better known as ARIMA (Pérez Cargua, 2017) by studying a seasonal factor that allowed understanding this effect in the longitudinal monthly historical series, corresponding to 259 observations from January 2001 to July 2022, obtained from the (BCE, n.d.) in statistical-documentary form through the econometric program Eviews 9. The application of this methodology began with the specification, verification, prediction, and use of the model Altamirano, 2021, which started with the review of the original model through the application of stationarity tests to ensure that the series was stable and allowed capturing the seasonal component for prediction. When this condition was not met, a first-difference transformation was applied to the series of natural flower exports to subsequently obtain a robust SARIMA model of monthly frequency (f=12) which served as the basis for the GARCH4 model (1,1) (Javed et al., 2022) model, which was subjected to validation tests for use in forecasting five data points between August and December 2022.
Results
By generalizing the ARMA (p,q) model by incorporating a difference to make the process stationary it becomes ARIMA (p,d,q) to eliminate the unit root. It is important to consider that the three components of this model are: autoregressive, integration by difference, and moving averages (Fernández Jiménez, 2008; Gujarati & Porter, 2010; León Anaya, 2017). The ARIMA equation is as follows:
 [1]
[1]By adding seasonality conditions to the ARIMA model, two important extensions are derived, which are: SAR and SMA, which relate to seasonal autoregressive and moving average processes that together make up the SARIMA model (P,D,Q), where D is the integration process or seasonal difference (Rosales Alvarez et al., 2010). This model allows the variable Yt to correlate with its seasonal lags (Franses et al., 2014).
The seasonal autoregressive variant of the SAR (p,d,q) (P,D,Q)f equation:
 [2]
[2]The seasonal moving average variant of the SMA (p,d,q) (P,D,Q)f equation:
 [3]
[3]The SAR and SAM combination in SARMA would be:
 [4]
[4]The SARIMA combination (p,d,q) (P,D,Q)f:
 [5]
[5]The Garch (p,q) model is mathematically defined as follows (El Jebari & Hakmaoui, 2019) as follows:
 [6]
[6]The GARCH model (generalized autoregressive conditional heteroscedastic conditional model) uses the variance and its lags () where is the volatility factor and the shocks that affect the model and it is required that:
 [7]
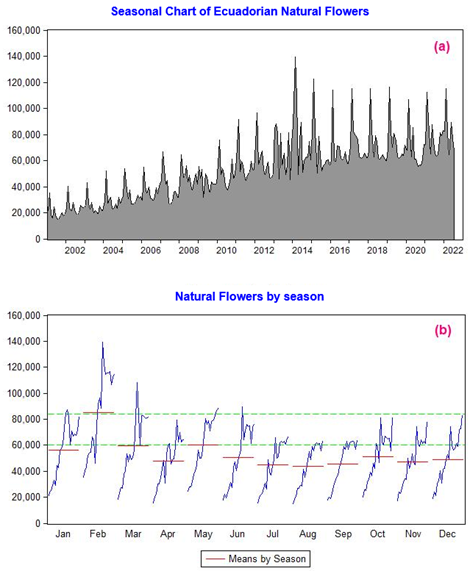
[7]When analyzing the original series in Illustration 3 (a), it is possible to observe values that exceed the average values and indicate seasonal characteristics that are repeated each period of the historical series under study.
Prepared by: Authors
By obtaining a graph in Eviews that breaks down the seasonality of the export series, it is possible to observe monthly periods that experience high FOB values, such as February, March, and May throughout the entire statistical series; and, in the case of Ecuador, it corresponds to events such as Valentine's Day as well as Mother's Day, when sales experience their highest economic growth internationally, and that according to Reinoso (2016, as cited in Cedillo Villavicencio et al., 2021), there are periods of high demand at high prices as well as low demand for the product, generating low export values to the Ecuadorian economy as is shown in Illustration 3 (b).
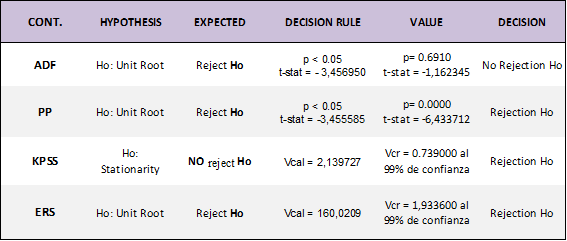
The ARIMA methodology begins with the specification, i.e. the evaluation of the natural flower export series and the contrasts that were applied: Dickey Fuller Augmented (DFA), Phillips Perron (PP), Kiatkowski, Phillips, Schmidt and Shin (KPSS) and Elliott Rotheberg and Stock (ERS) (Altamirano, 2021).The results are presented in Table 3 below.
Source: Altamirano (2021) . Prepared by: Authors
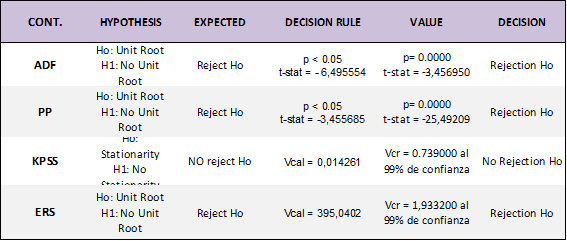
As can be seen, the series is not stationary; therefore, it requires a transformation process through a first difference to allowthe mean to be zero, E(wt )=0, and the variance approximately constant, Var(wt )=σ², a process known as white noise (Hamilton, 1994; Morales Oñate, n.d.). We therefore proceed to evaluate the criteria again in Table 4.
Source: Altamirano (2021). Prepared by: Authors
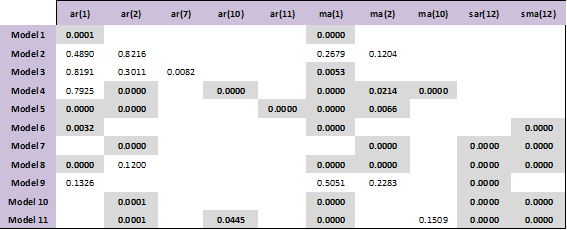
With these data, we proceed to determine the appropriate model and verify it according to the Box-Jenkins methodology, as shown in Table 5 below.
Prepared by: AuthorsNote: Coefficients in color are significant to 95%
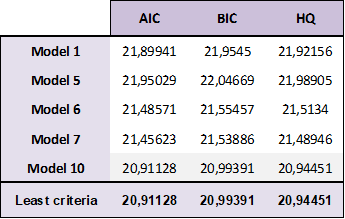
As can be seen, 11 models were obtained, and we proceeded to verify the one whose coefficients are significant, as in the case of models 1, 5, 6, 7, and 10, whose probability (p < 0.05. Through the application of the validation criteria Akaike (AIC), Schwarz (BIC), and Hannan-Quinn (HQ), the one with the smallest coefficient was chosen as technically adequate (Sánchez Verdezoto, 2021), as can be seen in the records of Table 6.
Prepared by: Authors
According to the evaluation shown in Table 6, the model that technically fits best is model 10. While, under the parsimony criterion, the first models could be considered, they would not capture the essence of the seasonality that is intended to be demonstrated in this research.
Model 10: d_ord_export c ar(2) ma(1) sar(12) sma(12)
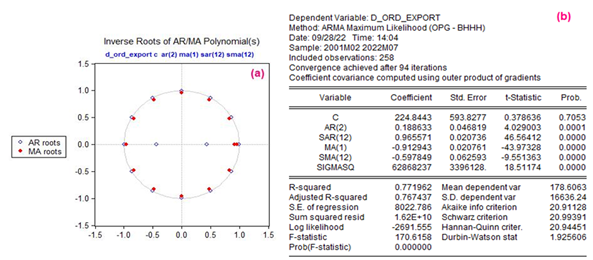
The model was subjected to unit root analysis, in order to rule out the possibility that the model is unpredictable and can be reliable, as shown in Illustration 4 (a) below:
Prepared by: Authors
In this sense, the model does not contain unit roots and the analysis of the residuals through the Durbin-Watson Criterion allows for the analysis of their independence, as shown in Illustration 4 (b) (Altamirano, 2021). The Durbin-Watson criterion is used to determine the independence of the residuals (Talero Sarmiento et al., 2019):
 [8]
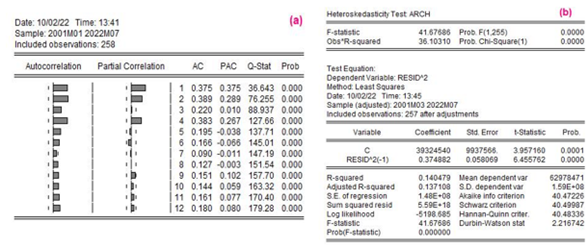
[8]The DW coefficient of 1.925606 allows us to accept the null hypothesis of independence of the residuals (Altamirano Pérez et al., 2022). With respect to the analysis of the squared residuals we observe that the model suffers from heteroscedasticity, since the probability values are less than 0.05, and the null hypothesis of homoscedasticity is rejected (see Illustration 5 (a)).
Prepared by: Authors
The probability value is less than 0.05 (p<0.05) and indicates a volatile model, which is complemented by the heteroskedasticity test in Illustration 5 (b) with a p-value of 0.0000, which determines variance problems.
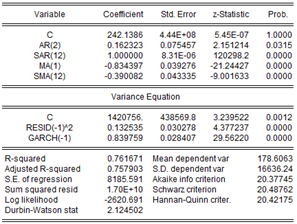
To correct the variance, it has been proposed that the model be structured under the ARCH family of heteroskedastic models developed in 19826 and its variant or extension GARCH (generalized autoregressive conditional heteroskedastic model) (El Jebari & Hakmaoui, 2019), proposed by Bollerslev (1986). This model abandons the traditional assumption of normality for the presence of time-varying variance (Javed et al., 2022) to correct these problems that affect the predictive process and is based on maximum likelihood criteria. The results of the GARCH model are shown in Illustration 6:
Prepared by: Authors
By analyzing the unit root processes, residuals and squared residuals to detect autocorrelation and heteroscedasticity, the problem has been corrected obtaining an acceptable coefficient of determination of 76%.
Prepared by: Authors
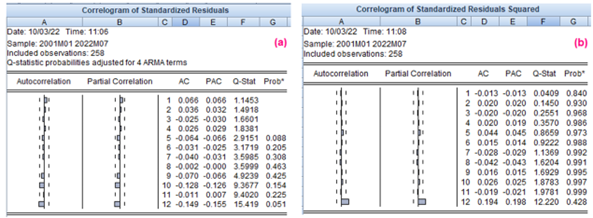
The probability p-values in Illustration 7 (a), exceed the condition of 0.05, therefore, there is independence of the residuals. In Illustration 7 (b), the p-values similarly exceed 0.05, which certifies the stability of the model, and especially when it is complemented with the Heteroscedasticity Test, which produced the values shown in Illustration 8, These values exceed the 0.05 threshold, as shown below:

Prepared by: Authors
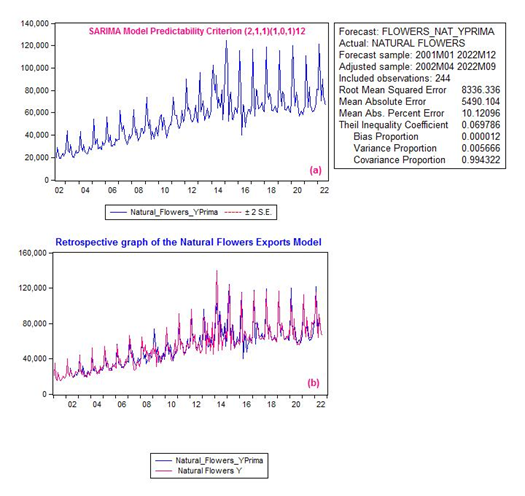
The next stage correlates with the prediction according to the proposed ARIMA methodology. Therefore, we proceed to determine the predictability criteria in Illustration 9 (a) for model 10, the results of which are presented below:
Prepared by: Authors
The criteria that determine the model's reliability are analyzed; its mean absolute percentage error (MAPE) is 10%, which means that it can be used within a moderate range for forecasting, considering the high volatility that can occur in the international market due to different circumstances that affect exports of various Ecuadorian products, as has happened with the pandemic and the current Russian invasion of Ukraine. Illustration 9 (b) shows the results obtained from the technical proposal of using the GARCH model with the SARIMA model as a fundamental basis for the original data.
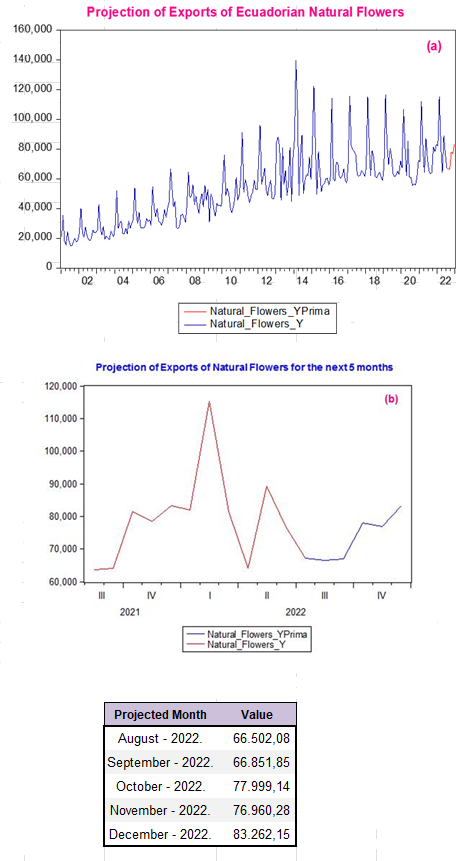
The predictions for the next five months, from August to December 2022 using this model are shown in Illustration 10 (a) in graphical form:
Prepared by: Authors
The projection equation that allows the modelling of this macroeconomic series of exports is detailed below:

The model corresponds to a SARIMA (2,1,1) (1,0,1)₁₂, where the coefficient ar(1) remains muted in the model. The projected values for the five out-of-sample data are broken down graphically and numerically in Illustration 10 (b), These projections allow for good growth expectations that will help sustain the national economy by providing resources to support decision-making related to the use of foreign currency in the General State Budget (PGE).
Discussion
The application of the SARIMA model is broad, in this case applied to the prediction of exports of Ecuadorian natural flowers, where the SARIMA model (2,1,1) (1,0,1)₁₂ indicates that with a moderate MAPE of 10% meets the conditions of stationarity and can be used to predict the last months of the year 2022. On the other hand, in the investigation of Carlos Andrés Salazar Bernal (2020) about the relationship of non-traditional exports of Ecuadorian flowers with respect to the economic growth, it is proposed a direct correlation model using ordinary least squares (OLS), obtaining a coefficient of determination of 0.93 to complement his study. Likewise, Josselin Gabriela Heredia Landeta (2023) conducts an analysis of the comparative advantage that Ecuadorian flowers had in the international market in the year 2021. This analysis is presented through multiple linear regression, obtaining a significant correlation of 77.3%; however, this analysis shows that flower production is inversely related to competitiveness. Regarding, Mayorga Abril et al. (2022) concur with the previous authors and propose four types of econometric models using ordinary least squares (OLS) to measure the competitiveness of Ecuadorian flowers compared to Colombian ones; exported to) the United States, concluding that in the period 2005 - 2020, Ecuador's competitiveness decreased by 56.9%, despite the growth in figures reported by the Central Bank of Ecuador and the statistics projected in this investigation.
Álvaro Román Bayona García y Lady Liliana Morales Choez (2019) considered two types of models for the analysis of exports of canned fish and flowers: a linear probability model (MPL) and a Probit-Logit model, and identified variables that affect these exports, including the size of the company, modernization, foreign investment, seniority, and properties; allowing the identification of public incentive policies that benefit these sectors.
Conclusions
There is evidence that Ecuadorian flower exports are subject to important seasonal influences that affect the economy. This implies that there are periods with higher and lower demand for flowers, related to holidays and special events in importing countries. This non-traditional product could be modeled using the Box-Jenkins methodology, obtaining a SARIMA model (2,1,1) (1,0,1)₁₂, which, after its evaluation, was suitable for building a GARCH model using maximum likelihood techniques that allowed capturing the volatile and cyclical characteristics of the monthly time series.
The contribution of GARCH models to governments is essential because they can directly predict and better manage risks associated with these variables and foreign policy strategies, which directly impacts economic policy decision-making that must consider the influence of external factors such as weather, price fluctuations as well as policies and trade agreements with other countries.
Finally, the use of the GARCH methodology in time series analysis has proven to be an effective tool in government economic policy and in making decisions about incentive policies associated with seasonal variables of SARIMA models because it can accurately identify and model the volatility of economic data and help governments make more efficient decisions.
Recommendations
The use of this methodology allowed the construction of models that were evaluated until the optimal one was obtained. Nevertheless, it is recommended for future research that the historical series be expanded and updated with more data so that the average absolute error percentage decreases and a model with a higher degree of robustness can be obtained.
Additionally, it is recommended that economic variables such as inflation, commodity prices, and imports, among others that contain high fluctuations, be understood and technically analyzed by the government's economic team, especially during periods of high demand, when the government could implement expansionary policies to control, facilitate, and promote flower exports, such as reducing red tape, improving logistics infrastructure, and incentivizing farmers to invest. In contrast, during periods of low demand, the government could take measures to counteract the effects of the crisis on the economy, diversifying productive investment towards other agro-export sectors and promoting, for instance, tourism as a factor of economic growth.
Limitations
The proposed methodology could be stronger if complemented with prediction techniques such as neural networks, multiple regression models, VAR models, among others that enrich the theoretical-practical scaffolding of applied econometrics.
Bibliographic References
Aguilar, P. M., Maldonado, D. B. y Solórzano, S. S. (2020). Incidencia de la balanza comercial en el crecimiento económico del Ecuador: análisis econométrico desde Cobb Douglas, período 1980-2017. Revista ESPACIOS, 41(3), 10. https://www.revistaespacios.com/a20v41n03/20410310.html
Altamirano, R. (2021). Modelo de pronóstico de ventas para la toma de decisiones gerenciales y financieras, un análisis con el método ARCH. Universidad Benito Juárez.
Altamirano Pérez, H. R., Morales Alberto, A. A., Tovar Pinzón, M. E. y Yance Gómez, L. E. (2022). Aplicación del modelo ARCH al pronóstico de ventas, un enfoque empresarial. Revista de la Facultad de Ciencias Económicas, 28(1), 149–170. https://doi.org/10.30972/rfce.2815947
Banco Central del Ecuador. (s.f.). Información Estadística Mensual (IEM). Recuperado el 28 de septiembre de 2022 de https://contenido.bce.fin.ec/home1/estadisticas/bolmensual/IEMensual.html
Banco Central del Ecuador. (2023). Evolución de la Balanza Comercial por Productos. https://contenido.bce.fin.ec/documentos/Estadisticas/SectorExterno/BalanzaPagos/balanzaComercial/indicepp.htm
Bayona García, Á. R. y Morales Choez, L. L. (2019). Factores que determinan de la probabilidad de exportación en los sectores de enlatados de pescado y flores naturales del Ecuador [Tesis de grado, Escuela Superior Politécnica del Litoral]. http://www.dspace.espol.edu.ec/handle/123456789/51789
Bollerslev, T. (1986). Generalized autoregressive conditional heteroskedasticity. Journal of Econometrics, 31(3), 307–327. https://doi.org/10.1016/0304-4076(86)90063-1
Cedillo Villavicencio, C., González Carrión, C., Salcedo Muñoz, V. y Sotomayor Pereira, J. (2021). El sector florícola del Ecuador y su aporte a la balanza comercial agropecuaria: periodo 2009 – 2020. Revista Científica y Tecnológica UPSE, 8(1), 74–82. https://doi.org/10.26423/rctu.v8i1.549
Durán Lima, J. y Álvarez, M. (2008). Indicadores de comercio exterior y política comercial: mediciones de posición y dinamismo comercial. Comisión Económica para América Latina y el Caribe. https://hdl.handle.net/11362/3690
El Jebari, O. y Hakmaoui, A. (2019). Modelos de la familia GARCH vs EWMA: ¿cuál es el mejor modelo para pronosticar la volatilidad del mercado de valores marroquí? Revista de Métodos Cuantitativos para la Economía y la Empresa, 26, 237–249. https://doi.org/10.46661/revmetodoscuanteconempresa.2662
Engle, R. F. (1982). Autoregressive Conditional Heteroscedasticity with Estimates of the Variance of United Kingdom Inflation. Econometrica, 50(4), 987–1007. https://doi.org/10.2307/1912773
Espinosa Acuña, O. y Vaca González, P. (2017). Ajuste de modelos GARCH Clásico y Bayesiano con innovaciones t-Student para el índice COLCAP. Economía del Caribe, 19, 1–32.
Fernández Jiménez, L. A. (2008). Modelos avanzados para la predicción a corto plazo de la producción eléctrica en parques eólicos [Tesis de Doctorado, Universidad de La Rioja]. https://investigacion.unirioja.es/documentos/5c13b152c8914b6ed37764aa
Formigoni Carvalho Walter, O. M., Henning, E., Moro, G. y Samohyl, R. W. (2013). Aplicação de um modelo SARIMA na previsão de vendas de motocicletas. Exacta, 11(1), 77–88. https://doi.org/10.5585/ExactaEP.v11n1.3897
Franses, P. H., Van Dijk, D. y Opschoor, A. (2014). Time Series Models for Business and Economic Forecasting. (2ª ed.). Cambridge University Press. https://doi.org/10.1017/CBO9781139049894
Gujarati, D. y Porter, D. (2010). Econometría. (5ª ed.). McGraw Hill.
Hamilton, J. D. (1994). Time Series Analysis. Princeton University Press.
Henao, R. N., Betancur Hinestroza, I. C. y Londoño Pineda, A. A. (2022). Geographic concentration of economic activities in Aburrá Sur in Antioquia (Colombia) — A Reinterpretation of the industrialisation coefficients of the stochastic independence approach. Economy of Regions, 18(1), 64–77. https://doi.org/10.17059/ekon.reg.2022-1-5
Heredia Landeta, J. G. (2023). La competitividad en el mercado internacional del sector florícola ecuatoriano. Un enfoque desde la producción y exportación [Tesis de grado, Universidad Técnica de Ambato]. https://repositorio.uta.edu.ec/handle/123456789/37586
Instituto Nacional de Estadísticas y Censos. (2012). Resultados de Clasificadores. Sistema Integrado de Consultas de Clasificaciones y Nomenclaturas. https://aplicaciones2.ecuadorencifras.gob.ec/SIN/resul_correspondencia.php?id=A0119.03&ciiu=12
Javed, F., Kiss, T. y Österholm, P. (2022). Performance analysis of nowcasting of GDP growth when allowing for conditional heteroscedasticity and non-Gaussianity. Applied Economics, 54(58), 6669-6686. https://doi.org/10.1080/00036846.2022.2075823
León Anaya, L. M. (2017). Aplicación de la descomposición empírica en modos a la predicción del mercado bursátil con los modelos de ARIMA - ARCH y redes neuronales artificiales evolutivas [Tesis de Maestría, Universidad Autónoma del Estado de México]. http://hdl.handle.net/20.500.11799/67404
Lima, J. R., Silva, J. de S. y Santos, R. K. B. (2013). Comportamento dos preços da manga exportada do Brasil: 2004-2012. Organizações Rurais & Agroindustriais, 15(3), 370–380. https://www.revista.dae.ufla.br/index.php/ora/article/view/735
Mayorga Abril, C., Imbaquingo Núñez, L., Pérez Briceño, J. y Cevallos Robles, J. (2022). La competitividad de las exportaciones florícolas del Ecuador con Colombia hacia el mercado de los Estados Unidos. Boletín de Coyuntura, 33, 7–15. https://doi.org/10.31243/bcoyu.33.2022.1672
Mena Vásconez, P., Vincent, L., Vos, J. y Boelens, R. (2017). Fighting over water values: diverse framings of flower and food production with communal irrigation in the Ecuadorian Andes. Water International, 42(4), 443–461. https://doi.org/10.1080/02508060.2017.1309511
Morales Oñate, V. (s. f.) Modelización de Series Univariantes: (S)ARIMA [Notas de clase]. Recuperado el 29 de febrero de 2023 de https://bookdown.org/victor_morales/SeriesdeTiempo/modelizaci%C3%B3n-de-series-univariantes-sarima.html#estac
Moreno, A., Narváez, D. y Sancho, S. (2016). Teorías del Comercio Internacional (Documento Técnico Nº11). Banco Central Del Ecuador.
Pérez Cargua, P. F. (2017). Desarrollo de un modelo de estimación de depósitos monetarios para un banco privado [Tesis de Maestría, Universidad Andina Simón Bolívar]. http://hdl.handle.net/10644/5996
Pinto, W. de P., Lima, G. B. y Zanetti, J. B. (2015). Análise comparativa de modelos de séries temporais para modelagem e previsão de regimes de vazões médias mensais do Rio Doce, Colatina - Espírito Santo. Ciência e Natura, 37(3), 1–11. https://doi.org/10.5902/2179460X17143
Ricardo, D. (1993). Principios de economía política y tributación. I Obra y correspondencia (Trad. J. Broc, N. Wolf y J. Estrada). Fondo de Cultura Económica. (Trabajo original publicado en 1950).
Rosales Alvarez, R. A., Perdomo Calvo, J. A., Morales Torrado, C. A. y Urrego Mondragon, J. A. (2010). Fundamentos de econometría intermedia: Teoría y aplicaciones. Apuntes de Clase CEDE, 1, 1-414.
Salazar Bernal, C. A. (2020). El impacto de las exportaciones de flores y sus efectos en el crecimiento económico en el Ecuador en el período 2004 -2017 [Tesis de grado, Universidad Técnica de Ambato]. https://repositorio.uta.edu.ec/handle/123456789/31703
Sánchez Verdezoto, C. A. (2021). Modelo matemático para la producción de la empresa Salinerito en la Provincia de Bolívar [Tesis de Maestría, Universidad Técnica de Ambato]. https://repositorio.uta.edu.ec/handle/123456789/32214
Silva, C. R. da, Machado, S. L. D., De Araújo, A. A. y De Abreu Junior, C. A. M. (2018). Analysis of the phenology dynamics of Brazilian caatinga species with NDVI time series. Cerne, 24(1), 48-58. https://doi.org/10.1590/01047760201824012487
Subgerencia de Análisis de Productos y Servicios. (Septiembre de 2019). Ficha Sectorial: Cultivo de Flores. Corporación Financiera Nacional.
Subgerencia de Análisis de Productos y Servicios. (Agosto de 2020). Ficha Sectorial: Cultivo de Flores. Corporación Financiera Nacional.
Subgerencia de Análisis de Productos y Servicios. (Septiembre de 2021). Ficha Sectorial: Cultivo de Flores. Corporación Financiera Nacional.
Subgerencia de Análisis e Información. (Octubre de 2017). Ficha Sectorial: Cultivo de Flores. Corporación Financiera Nacional.
Subgerencia de Análisis e Información. (Septiembre de 2018). Ficha Sectorial: Cultivo de Flores. Corporación Financiera Nacional.
Talero Sarmiento, L. H., Lamos Díaz, H. y Garavito Hernández, E. A. (2019). Testing the Weak Form of Efficient Market Hypothesis and Causality Analysis in Colombian Food Supply Centers. Apuntes del Cenes, 38(67), 35–69. https://doi.org/10.19053/01203053.V38.N67.2019.8040
Thushara, S. C., Su, J.-J. y Bandara, J. S. (2019). Forecasting international tourist arrivals in formulating tourism strategies and planning: The case of Sri Lanka. Cogent Economics & Finance, 7(1), 1699884. https://doi.org/10.1080/23322039.2019.1699884
Tudela Mamani, J. W., Cahui Cahui, E. y Aliaga Melo, G. (2022). Impacto del COVID-19 en la demanda de turismo internacional del Perú. Una aplicación de la metodología Box-Jenkins. Revista de Investigaciones Altoandinas, 24(1), 27–36. https://doi.org/10.18271/ria.2022.317
Valero Córdoba, G. M., Rodenes, M. y Rueda, G. E. (2016). La internacionalización de las empresas exportadoras. Estado de la cuestión. Revista Lebret,(8),127–147. https://doi.org/10.15332/rl.v0i8.1689
Notes
Información adicional
Clasificación JEL: M11, Q53
