Artículo científico
Forecasting inflation with twitter
Pronóstico de la inflación con Twitter
Revista Económica La Plata
Universidad Nacional de La Plata, Argentina
ISSN: 1852-1649
Periodicity: Anual
vol. 69, no. 1, 2023
Received: 07 October 2022
Accepted: 05 May 2023

This work is licensed under Creative Commons Attribution-NonCommercial-NoDerivs 4.0 International.
Abstract: We use Twitter content to generate an indicator of attention allocated to inflation. The analysis corresponds to Argentina for the period 2012-2019. The attention index provides valuable information regarding future levels of inflation. A one standard deviation increment in the index is followed by an increment of approximately 0.4% in inflation in the consecutive month. Out-of-sample exercises confirm that social media content allows for gains in forecast accuracy. Beyond point forecasts, the index provides valuable information regarding inflation uncertainty. The proposed indicator compares favorably with other indicators such as media content, media tweets, google search intensity and consumer surveys.
Keywords: inflation, social network, forecasting, uncertainty, text analysis.
Resumen: Se utiliza el contenido de Twitter para generar un indicador de atención asignada a la inflación. El análisis corresponde a Argentina para el período 2012-2019. El índice de atención proporciona información valiosa sobre los niveles futuros de inflación. Un incremento de una desviación estándar en el índice es seguido de un incremento de aproximadamente un 0,4% en la inflación en el mes consecutivo. Los ejercicios fuera de la muestra confirman que el contenido de las redes sociales permite obtener ganancias en la precisión de los pronósticos. Más allá de los pronósticos puntuales, el índice proporciona información valiosa sobre la incertidumbre de la inflación. El indicador propuesto se compara favorablemente con otros indicadores como el contenido de los medios, los tweets de los medios, la intensidad de búsqueda en Google y las encuestas de consumidores.
Palabras clave: inflación, redes sociales, pronósticos, incertidumbre, análisis de texto.
I. Introduction
Can social media content be used to construct valuable indicators in macroeconomic contexts? For example, can valuable indicators of inflation dynamics be derived from social media content? So far, the literature has failed to identify instances in which valuable indicators emerge. This is in contrast with numerous contributions that show how media content and policy making documents provide information regarding future macroeconomic dynamics (see Baker et al., 2016, Thorsrud, 2020, Sharpe et al., 2020 and Aromí, 2020). This is also in contrast with numerous studies that demonstrate the value of social media content in analyses of high frequency developments in financial markets (see Bollen et al., 2011, Azar and Lo, 2016, Oliveira et al., 2017).
One likely reason for these contrasts is that macroeconomic events take place at low frequency and, as a consequence, a reliable evaluation requires a long database of social media content that is not easy to collect. Complementarily, it can be conjectured that social media is noisy or insufficiently attentive to macroeconomic developments and, as a result, it is difficult to construct informative indicators.
In this study, we implement an analysis of Twitter content and inflation for the case of Argentina. Two distinguishing features of our study suggest that the exercise is likely to provide useful insights regarding the information content of social networks. First, this work is based on an extensive sample of Twitter content that covers the period 2012-2019. In relative terms, this is a long dataset of social media content that is expected to allow for an informed evaluation. Second, during the sample period, inflation has been a recurrent and highly disruptive feature of the Argentine economy. The resulting high level of attention allocated to this issue provides a convenient context for the evaluation social media information content.
Our indicator of social media content is based on a simple and transparent methodology that intends to approximate the level of attention allocated to inflation. The monthly value of the index is equal to the number of mentions of inflation detected in a given month in a sample of Argentine tweets divided by the number of tweets sampled for that month.
The empirical evidence indicates Twitter content anticipates macroeconomic outcomes. More specifically, the indicator of the level of attention allocated to inflation provides valuable information regarding inflation levels and inflation uncertainty. Estimated forecasting models indicate that a one standard deviation increment in the attention index is associated to an increment of 0.4% in mean inflation in the following month.1
Out-of-sample forecasts confirm that the index allows for significant gains in forecast accuracy. Depending in the selected evaluation period, under our preferred specification, the forecast gains range between 13% and 17%. Complementarily, higher values of the attention index anticipate increments in inflation uncertainty. An increment of one standard deviation in the attention index is associated to an increment of 28% in our estimate of inflation uncertainty in the following month.
The information gains are different from and compare favorably with the information provided by lagged inflation and lagged devaluation rate. Also, analyses show that these information gains are substantive compared to those that result from using traditional macroeconomic indicators such as the level of economic activity, monetary aggregates and interest rates. Furthermore, the information content of four alternative indicators of expectations are also evaluated: Google search Volume, newspaper content, mass media tweets and a consumer survey. These analyses confirm that social media data constitutes a particularly valuable source of information regarding future inflation.
From a broad perspective, the current study is motivated by the idea that inflation is the result of an emergent evolving process (Heymann and Leijonhufvud, 1995; Arifovic, 1995; De Grauwe and Ji, 2019). The emergence of adaptive forward-looking behavior implies that traditional variables, such as interest rates, monetary aggregates and levels of activity, might not summarize all available information regarding the evolution of the process. Hence, indicators of subjective states that co-evolve with the price level are likely to contain valuable information regarding subsequent dynamics. Furthermore, in the case of volatile emerging economies, such as the case we analyze in this work, changes in policy regimes and limited policy maker credibility augment the relevance of subjective indicators.
The role for the level of social media attention as an indicator of future inflation and inflation uncertainty is also linked to the insights formalized by the rational inattention literature. According to this perspective, the allocation of attention is adjusted with the value of incoming information (Sims, 2003; Mackowiak and Wiederholt, 2009). The allocation of more attention to inflation might point to optimal responses to the arrival of news regarding the future evolution of inflation.
Complementarily, this study is also connected to macroeconomic models of sunspots or multiple equilibria (Benhabib and Farmer, 1999; Ascari et al., 2019). In these models, the macroeconomic trajectory is, in part, determined by the coordination of behavior and expectations. More public discussion of the inflation rate might be associated to innovations in the coordination of price setting behavior. These innovations are not necessarily captured in a rapid or accurate manner by traditional macroeconomic indicators. In this way, social media content emerges as a valuable indicator of price level uncertainty and expected trajectory.
Our contribution is most closely to a substantive literature on inflation forecasts (see, for example, the survey by Faust and Wright, 2013). This literature analyzes the information content of macroeconomic variables, financial indicators and surveys (Stock and Watson, 1999; Ang et al., 2007; Sharpe et al., 2020). In addition, this literature considers alternative modeling techniques (Ang et al., 2007; Schorfheide and Song, 2015) and changes in the forecasting ability of models (Rossi and Sekhposyan, 2010).
This article provides novel results to this literature showing the value of novel forms of data. The main original contribution of this paper is to demonstrate that, in the context of a volatile emerging economy, a simple summary of social media content emerges as a valuable tool in the context of inflation forecasts. Complementarily, we evaluate this predictor jointly with other indicators and show that it provides new information that is not provided by other more established predictors. Finally, we show that this indicator might also be a valuable tool for the assessment of inflation uncertainty.
In the next section, the data and the methodology are described. Section 3 analyzes inflation forecast and the attention index. Inflation uncertainty is analyzed in the following section. Alternative indicators of subjective states are evaluated in section 5. Conclusions are presented in section 6.
II. Data and methodology
As previously mentioned, we want to evaluate if Twitter messages contain valuable information regarding the evolution of inflation and whether these data can be used to forecast inflation in Argentina. We use two different types of information: traditional data (such as past inflation and exchange rates) and subjective indicators which result from summarizing a large collection of messages. The sample period is January 2012 through September 2019.
The first set of data is given by the consumer price index and the exchange rate. The consumer price index data is from the National Institute of Statistics and Census (INDEC for its acronym in Spanish).2 The Argentine peso-US dollar exchange rate time series is from the Central Bank.3 Given the value of each time series on month , we compute the monthly variation which is given by the log-difference between month t and month t - 1 values:.
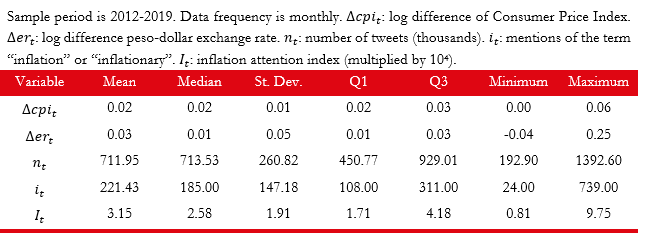
Table 1 shows descriptive statistics for the inflation rate and the evolution of the exchange rate .4 The table shows that the average monthly inflation rate for the period was 2%. The period was characterized by high volatility as indicated by the standard deviation of, approximately, 1%. The inflation rate reaches its maximum sample value of 6% on April 2016, a few months after an important devaluation and following nationwide increments in utility rates. The inflation rate achieved its minimum value (0.2%) in August 2016 as a consequence of a reversal of the previously mentioned increments in utility rates. The average monthly devaluation rate for the sample period is approximately 3%. This period was also volatile in terms of the foreign exchange rate with a standard deviation of 5%, a maximum value of 25% and a minimum of −4%.
The second type of data is social media content that is used to construct an indicator of attention allocated to inflation by users in Argentina. Twitter messages were collected for the period 2012-2019. The data source corresponds to a random sample of 1% of the messages that is provided free of charge by Twitter through its API. These tweets were collected and are distributed by the Internet Archive.5 A corpus of “Argentine” social media content is created selecting those tweets for which the user-reported location includes the word “Argentina”. This results in a subset of approximately 70 million tweets.6
Given the corpus of Argentine tweets, an indicator of attention is built computing the frequency of the noun “inflation” and the adjective “inflationary”.7 This is a simple and transparent strategy through which the large collection of unstructured data is summarized. More specifically, let it represent the number of times a keyword is detected in messages corresponding to month t and represent the total number of tweets corresponding to month t. Then, the corresponding value of the inflation attention index is given by . A higher number is interpreted as more attention being allocated to inflation.
As shown in the last row of Table 1, on average, there were three mentions to inflation per ten thousand tweets. An informal inspection of the index suggests that it is able to capture information related to inflation dynamics. The maximum value of the index, 9.75, corresponds to May 2018. This is a month of high volatility in the foreign exchange market and coincides with the start of a period marked by high inflation and a persistent economic and financial crisis. The minimum value of the index corresponds to July 2015. This is a period of relatively low inflation.
In this way we propose an indicator that summarizes social media content by counting words and dividing by the number of messages. The simplicity of this approach implies that we are not modeling the impact of many factors that change the nature of the dataset used to construct the index. For example, during the sample period, the volume and composition of Twitter users changed in a very notable way8. For another example, in 2017 the platform doubled the maximum number of characters per message.9
Source: own elaboration.
This study implements a simple evaluation of the information content through a transparent indicator. An evaluation of the optimal design of the indicator given multiple changes in the platform rules and the continuous changes in the composition and attitudes of the members of the community is left for future research.
Figure 1 provides further evidence on the co-movement of inflation and the attention index. Three notable increments in the attention index coincide with three episodes of important increments in the inflation rate. Those three instances correspond to early 2014, the first half of 2016 and 2018. Additionally, the coefficient of correlation between inflation and the attention index is 0.47. Interestingly, suggesting that the index captures forward-looking information, the coefficient of correlation increases to 0.55 when the one-month-lagged attention index is considered.
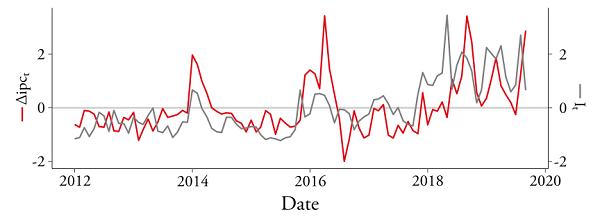
Source: own elaboration.Note: To facilitate comparisons, both time series were standardized.
III. Inflation forecasts
In this section, the information content of the indicator of inflation attention is evaluated through a series of forecasting exercises. The forecasting models are given by an autoregressive specification that, depending on the specification, is complemented with an indicator of lagged Twitter content or the lagged change in the foreign exchange rate. The number of lags is selected minimizing the Bayesian Information Criterion.10
More formally, let be the value of a Consumer Price Index in month t. The inflation rate computed on month t is given by . The baseline autoregressive model is given by:
where is the error term.
Before incorporating the indicator of attention, we propose a second model with the monthly devaluation rate as predictor. In this way, estimated expected inflation is conditioned on a larger information set. Let represent the monthly devaluation rate corresponding to month t. Then, the second baseline autoregressive model satisfies:
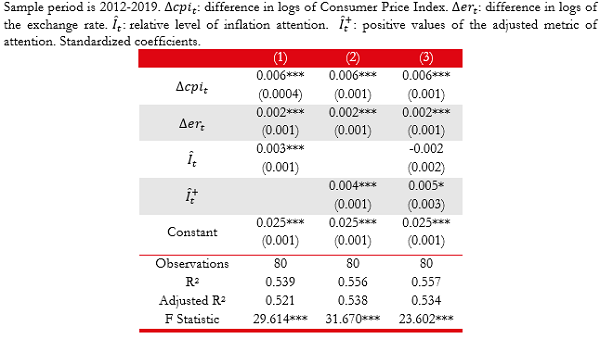
The predictive ability of social media content is evaluated through extended models that incorporate, as predictor, one of two specifications of the indicator of attention. The first specification is the original indicator described above. The second indicator can be interpreted as an adjusted metric of attention. More specifically, the second indicator is given by: . That is, the indicator measures differences between the latest value of the indicator of attention and its average level during the previous year. This alternative specification allows for robustness tests. At the same time, it permits a simple exploration of the appropriateness of alternative specifications. Formally, the forecasting models used to estimate the information content of social media indices are given by the following equation:
where is equal to or and in some model specifications is set equal to 0. The parameter of interest is . is the error term. Models are estimated for the period 2012-2019. The predictors are standardized to facilitate the comparison of the economic significance of different estimated parameters.
Table 2 shows the estimations of the different specifications of the forecasting models. The baseline models indicate that lagged monthly inflation and lagged devaluation are statistically and economically significant predictors of inflation. Adjusted R2’s suggest that these variables contain substantive information regarding subsequent levels of inflation.11
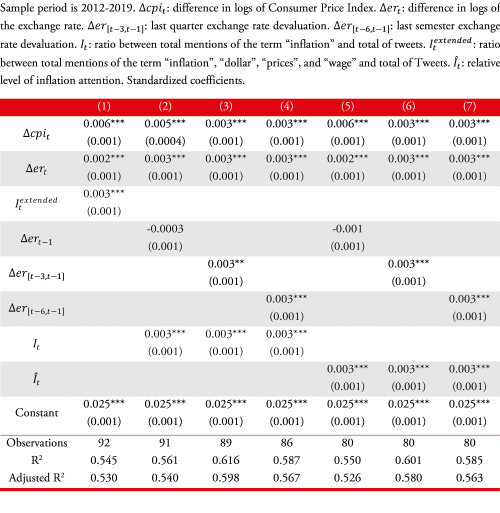
The estimated extended models indicate that social media content adds information regarding future inflation levels. A one standard deviation increment in the indicator of attention anticipates a mean increment of approximately 0.4% in monthly inflation. Column 1 in Table A.1 shows that the estimated coefficient associated to inflation attention index is similar when we extend the list of terms related to inflation term (i.e., “dollar”, “prices”, “wage”).

Source: own elaboration.Note: standard errors in parenthesis are estimated following Newey and West (1987, 1994). *p<0.1; **p<0.05; ***p<0.01.
On the other hand, it is worth noting that these observations do not depend on the baseline model under consideration or the specification of the social media content indicator. Appendix A evidences that these regularities remain when we incorporate lags on devaluation rate to control for delays in the pass-through from exchange rate to prices. Adjusted R2’s point to noticeable gains in anticipatory ability. For example, in the first baseline model, the adjusted R2 increases from 0.427 to more than 0.50 as summaries of social media content are incorporated as predictors.
Having established that social media provides valuable information regarding future levels of inflation, we present additional analyses that characterize this information in more detail. First, we estimate a nonlinear model to explore the value of alternative specifications. Then, we evaluate if the information provided by the attention index overlaps with the information provided by traditional macroeconomic indicators such as interest rates, monetary aggregates or economic activity.
Are increments in attention as informative as drops in attention? To provide an answer to this question we use the adjusted metric of attention, , to compute a second indicator of attention that is equal to the adjusted metric of attention if positive and zero otherwise: . Then we estimate forecast models in which this new indicator is used as a predictor. In Table 3 the estimated models suggest
Source: own elaboration.Note: tandard errors are estimated following Newey and West (1987, 1994). *p<0.1; **p<0.05; ***p<0.01.
that increments in attention are particularly informative. More specifically, when the indicator of increments in attention, , is used as the predictor, the estimated coefficients and the metrics of model fit increase. Additionally, when the adjusted metric, , is incorporated as a second indicator, its coefficient is not significantly different from zero. While our ability to identify the best forecast model is constrained by sample size, these evaluations suggest that there are gains associated to considering more flexible specifications.
Is the information provided by social media content different from the information provided by traditional indicators? We consider three traditional indicators to address this question: economic activity, interest rates, and monetary aggregates. The monthly indicator of economic activity, , is from the national statistics office.12 The monetary aggregate, , is the monetary base.13 Interest rates, , corresponds to 30 through 59-day term deposits.14

Source: own elaboration.Note: standard errors are estimated following Newey and West (1987, 1994). *p<0.1; **p<0.05; ***p<0.01.
Table 4 shows the estimated models that incorporate these traditional variables as predictors after standardization. The estimated coefficients associated to these variables have the expected sign. Nevertheless, statistical significance is consistently observed only in the case of interest rates. Importantly, for all model specifications, the coefficient corresponding to the indicator of Twitter content is positive and significant. Additionally, the estimated coefficient remains mostly unaltered as different macroeconomic variables are incorporated to the model. These results suggest that the attention index provides valuable information that is different from the information provided by traditional economic indicators.
Summarizing, the evidence reported above suggests that indices based on social media content have valuable information regarding future levels of inflation. These findings are robust to changes in the set of predictors and the specification of the indicator. Also, the information provided by the attention index is different from that provided by traditional macroeconomic indicators. Appendix B evidences a more distant association between social media content and subsequent levels of inflation rate.
III.1 Out-of-sample forecast
To provide further insights on the information content of social media we implement out of sample forecasts exercises in which models are trained recursively with past information. The performance of forecast generated by the baseline autoregressive model are compared to forecasts produced by models that incorporate an additional predictor. Four predictors are considered: monthly devaluation rate ( ), the inflation attention index ( ), the adjusted level of attention () and increments in attention () .
Each forecast model is evaluated computing the root-mean-square prediction error (RMSE). For extended models these measure of accuracy is also expressed as a fraction of the RMSE of the baseline model. The performance of the models is assessed using two alternative starting dates for pseudo out-of-sample forecast exercise. The starting dates are selected so that the smallest training subsample represents 60% and 80% of the full sample respectively. Following Faust et al. (2013), resampling techniques are implemented to compute the statistical significance of the differences in accuracy.15
Table 5 shows the results for out-of-sample forecast exercises. For all extended models, the estimated forecast accuracy is higher than that observed in the case of the baseline model. These differences are statistically significant in all but one case. For forecasts generated by a single predictor, the strongest performance is observed in the case of the original inflation attention index . The last row of the table shows that forecast combinations allow for further gains in accuracy. In summary, these out-of-sample forecast exercises provide further support to the idea that social media content provides valuable information regarding future levels of inflation.

Source: own elaboration.
IV. Inflation uncertainty
Beyond inflation forecasts, social media can be conjectured to provide information regarding inflation uncertainty. This is a question of interest since inflation uncertainty has important economic consequences (Huizinga, 1993, Heymann and Leijonhufvud, 1995 and Elder, 2004). Our metric seems adequate for this task since higher inflation uncertainty is likely accompanied by a higher level of attention that can be inferred from social media messages. More specifically, under rational inattention, the allocation of attention is adjusted with the value of incoming information (Sims, 2003; Mackowiak and Wiederholt, 2009). Hence, the allocation of more attention to inflation is consistent with the arrival of valuable news regarding the future evolution of inflation. Complementarily, considering the literature on multiple equilibria or sunspots (Benhabib and Farmer, 1999; Ascari et al., 2019), more public discussion of the inflation might be linked to innovations in the coordination of price setting behavior.
Our first evaluation involves estimating quantile regressions that characterize the distribution of inflation shocks as a function of three variables of interest. Formally, shocks are approximated by residuals of an autoregressive model:
Then, quantile of the shock conditional on the value of indicator is modeled as an affine function:
where the can be one of three indicators: inflation , devaluation rate , or the adjusted indicator of inflation attention .
Figure 2 and Table 6 provide information on the estimated quantiles. The estimations suggest that the attention index is associated to important changes in uncertainty. In particular, the interquartile range of the shock is estimated to increase from 0.47 to 0.83 as the attention index increases from one standard deviation below the mean to one standard deviation above the mean. This strong association between the attention index and uncertainty, proxied by forecast errors, are not observed when quantiles are estimated as a function of lagged inflation or lagged devaluation.

Source: own elaboration.Note: Given quantile is modeled as . Estimated quantiles are conditioned on with . To facilitate comparisons, in each case, the indicator on which quantiles are conditioned, , was standardized.
To complement the previous results, we evaluate the association between inflation uncertainty and social media attention estimating simple forecasting models. Following Rossi and Sekhposyan (2015), inflation uncertainty is proxied using the mean absolute forecast error: . Then, we propose simple empirical models in which uncertainty is function of indicators . Formally, when all indicators are incorporated, the inflation uncertainty forecast model is given by:
Source: own elaboration.Note: standard errors are estimated following Newey and West (1987, 1994). *p<0.1; **p<0.05; ***p<0.01.
Table 6 confirms that the attention index provides valuable information regarding inflation uncertainty. A one standard deviation increment in the attention index is associated to a 30% increment in the expected mean absolute error. In contrast, no robust association is found when the other two indicators are considered. In the case of the devaluation rate, no statistically significant relationship is found. In the case of lagged inflation, a positive relationship is found in the case of the univariate model. This association loses statistical significance once the attention index is incorporated as a predictor in the model.
V. Evaluation of other subjective indicators
The previous analyses show that social media content provides valuable information regarding future levels of inflation and inflation uncertainty. One open question is whether other indicators of subjective states display similar capacity to provide information regarding future inflation. In this subsection, we estimate inflation forecast models that allow for a comparison of the information content of multiple alternative indicators of subjective states.
Three types of indicators are considered. First, we evaluate search intensity indices from Google Trends. We consider two keywords: “inflacion” (inflation) and “dolar” (dollar). The selection of “dolar” as a keyword responds to the strong association between the exchange rate and the rate of inflation. Also, we consider two indicators of media attention. One index is constructed processing the full text of the economic section of “La Nación” a prominent Argentine newspaper16. The second mass media index is constructed processing a collection of 1.4M tweets from 6 major news outlets: “ambitocom”, “clarincom”, “cronistacom”, “infobae”, “lanacion” and “perfilcom”. Finally, we also use the index of household inflation expectations from CFI-UTDT. More specifically, in the absence of an indicator of expected inflation for the next month, we use the median expected inflation over the next 12 months.
As in the previous exercises, we estimate simple autoregressive models that incorporate an additional predictor. Table 7 shows the estimated forecasting models for the alternative subjective indicators. To facilitate comparisons, each subjective indicator was standardized. Interestingly, mass media content and mass media tweets fail to provide information regarding future inflation. These results suggest that, in the case under analysis, mass media might not play a central or leading role in the formation of macroeconomic expectations. On other hand this is a tentative statement since we must consider the impact of difference in the size and coverage of each corpus and the sensitivity to adjustments in the methodology used to extract information from each corpus.17Hence, a more comprehensive analysis is needed to arrive to more informative evaluation of the centrality of each type of source of information.
Negative results are also observed in the case of household surveys. While preliminary, this evidence points to limits in our capacity to extract subjective information through questionnaires. In contrast, search intensity indicators are shown to contain valuable information. In particular, a strong performance is observed in the case of the indicator of search intensity for the keyword “dollar”. In consistence with the previous sections, the evidence linked to search intensity suggest that indicators of online behavior of a large quantity of users constitutes a valuable tool to extract forward-looking macroeconomic information.
Table C.1, in Appendix C, evidences that social media content captures valuable information regarding future inflation rate even when we simultaneity control by google intensity search indexes and traditional macroeconomic indicators. This result remains when we add household inflation expectations as control.
VI. Conclusions
This paper examines the information content of social media messages. More specifically, we analyze “Argentine” tweets for the period 2012-2019. The evidence indicates that Twitter messages provide valuable information regarding expected inflation and inflation uncertainty. The information content is economically significant. An increment of one standard deviation in the index is associated with by an increment of 0.4% in inflation in the following month. The information content of the index is different from that provided by traditional macroeconomic indicators. These findings are robust to changes in the specification of the forecast exercise.
There are several directions in which these exercises can be extended. First, in this work, attention to inflation was approximated using an extremely simple but transparent strategy to summarize unstructured information. The use of natural language processing models could allow for gains in the capacity to extract information from Twitter messages. In a similar direction, models of community detection could be used to discover clusters of users whose content is particularly informative. Finally, this study evaluated regularities using monthly time series. Analyses at higher frequencies can provide further insights regarding the relationship between social media content and inflation dynamics.
Acknowledgments
We would like to thank Sergio De Raco and Fabio Gasparri for their advice on how to process large json files. We would also like to thank María Laura Antunez, Juan Cabral y Santiago López for very valuable research assistance. We benefited from useful comments received at the UNLP Economic Dept. Seminar and the 3rd Workshop on Complex System hosted by IIEP.
References
Ang, A., Bekaert, G., and Wei, M. (2007). Do macro variables, asset markets, or surveys forecast inflation better? Journal of monetary Economics, 54(4), 1163–1212.
Arifovic, J. (1995). Genetic algorithms and inflationary economies. Journal of Monetary Economics, 36(1), 219‑243.
Aromí, J. D. (2020). Linking words in economic discourse: implications for macroeconomic forecasts. International Journal of Forecasting, 36(4), 1517‑1530. https://doi.org/10.1016/j.ijforecast.2019.12.001
Ascari, G., Bonomolo, P., and Lopes, H. F. (2019). Walk on the wild side: temporarily unstable paths and multiplicative sunspots. American Economic Review, 42(5), 123–134.
Azar, P. D. and Lo, A. W. (2016). The wisdom of twitter crowds: predicting stock market reactions to fomc meetings via twitter feeds. The Journal of Portfolio Management, 42(5), 123–134.
Baker, S. R., Bloom, N., and Davis, S. J. (2016). Measuring economic policy uncertainty. The Quarterly Journal of Economics, 131(4), 1593–1636.
Benhabib, J. and Farmer, R. (1999). Chapter 6 iIndeterminacy and sunspots in macroeconomics. In J. B. Taylor and M. Woodford (Eds.), Handbook of Macroeconomics (Vol. 1A, pp. 387–448). Elsevier.
Bollen, J., Mao, H., and Zeng, X. (2011). Twitter mood predicts the stock market. Journal of computational science, 2(1), 1–8.
De Grauwe, P. and Ji, Y. (2019). Inflation targets and the zero lower bound in a behavioural macroeconomic model. Economica, 86(342), 262–299.
Elder, J. (2004). Another perspective on the effects of inflation uncertainty. Journal of Money, Credit and Banking, 911–928.
Faust, J., Gilchrist, S., Wright, H. J., and Zakrajsek, E. (2013). Credit spreads as predictors of real-time economic activity: a bayesian model-averaging approach. The Review of Economics and Statistics, 95(5), 1501–1519.
Faust, J. and Wright, H. J. (2013). Chapter 1 - forecasting inflation. In G. Elliott and A. Timmermann (Eds.), Handbook of Economic Forecasting (Vol. 2, pp. 2–56). Elsevier.
Heymann, D. and Leijonhufvud, A. (1995). High Inflation: the arne ryde memorial lectures. Oxford University Press.
Huizinga, J. (1993). Inflation uncertainty, relative price uncertainty, and investment in us manufacturing. Journal of Money, Credit and Banking, 25(3), 521–549.
Mackowiak, B. and Wiederholt, M. (2009). Optimal sticky prices under rational inattention. American Economic Review, 99(3), 769–803.
Newey, W. K. and West, K. D. (1987). A simple, positive semi-definite, heteroskedasticity and autocorrelation consistent covariance matrix. Econometrica, 55, 703–708.
Newey, W. K. and West, K. D. (1994). Automatic lag selection in covariance matrix estimation. The Review of Economic Studies, 61(4), 631–653.
Oliveira, N., Cortez, P., and Areal, N. (2017). The impact of microblogging data for stock market prediction: Using twitter to predict returns, volatility, trading volume and survey sentiment indices. Expert Systems with Applications, 73, 125–144.
Rossi, B. and Sekhposyan, T. (2010). Have economic models’ forecasting performance for us output growth and inflation changed over time, and when? International Journal of Forecasting, 26(4), 808–835.
Rossi, B. and Sekhposyan, T. (2015). Macroeconomic uncertainty indices based on nowcast and forecast error distributions. American Economic Review, 105(5), 650–655.
Schorfheide, F. and Song, D. (2015). Real-time forecasting with a mixed-frequency var. Journal of Business Economic Statistics, 33(3), 366–380.
Sharpe, S. A., Sinha, N. R., and Hollrah, C. A. (2020). The power of narratives in economic forecasts (Finance and Economics Discussion Series 2020-001r1). Federal Reserve Board.
Sims, C. (2003). Implications of rational inattention. Journal of Monetary Economics, 50(3), 665–690.
Stock, J. H. and Watson, M. W. (1999). Forecasting inflation. Journal of Monetary Economics, 44(2), 293–335.
Thorsrud, L. A. (2020). Words are the new numbers: a newsy coincident index of the business cycle. Journal of Business & Economic Statistics, 38(2), 393–409.
Appendix A. Forecasting models: extensions
Source: own elaboration.Note: : standard errors in parentheses are estimated following Newey and West (1987, 1994). ∗p<0.1; ∗∗p<0.05; ∗∗∗p<0.01
Appendix B. Forecasting models months ahead

Source: own elaboration.Note standard errors in parentheses are estimated following Newey and West (1987, 1994). ∗p<0.1; ∗∗p<0.05; ∗∗∗p<0.01
Appendix C. Alternative social media: extensions

Source: own elaboration.Note standard errors in parentheses are estimated following Newey and West (1987, 1994). ∗p<0.1; ∗∗p<0.05; ∗∗∗p<0.01
Notes
Additional information
Clasificación
JEL: E31,
E37, E70

HTML generated from XML JATS4R
