Artículos
Demographic Dividends and Economic Growth in Latin America. A Low and Middle-Income Trap Equilibrium
Dividendos demográficos y crecimiento económico en América Latina. Un equilibrio de trampa de ingresos medio y bajo.
Revista Económica La Plata
Universidad Nacional de La Plata, Argentina
ISSN: 1852-1649
Periodicity: Anual
vol. 67, e020, 2021
Received: 06 August 2019
Accepted: 02 February 2021

This work is licensed under Creative Commons Attribution-NonCommercial-NoDerivs 4.0 International.
Abstract: The objective of this paper is to analyze the possibility of a low and middle-income trap for the Latin American countries due to demographic changes. Based on the use of a panel data from 16 countries duringthe period from 1970 to 2014, it is identified that the growth of GDP per capita is related with the firstdemographic dividend. However, given the dynamics of the fertility rate, we identify a latent risk of low andmiddle-income trap equilibrium in the long term unless there is an increase in the saving rate, investment and, therefore, the long-term productivity.
Clasificación JEL: O4, J1
Keywords: Demographic dividends, Economic growth, Support ratio.
Resumen: El objetivo del presente trabajo es estudiar el posible alcance de un equilibrio de trampa de ingresos medios y bajos para los países de América Latina debido a la transición demográfica. A partir de la utilización de datos de panel con 16 países durante el período 1970-2014 se identifica una contribución significativa del primer dividendo demográfico al crecimiento del PBI per cápita. Sin embargo, dada la dinámica de la tasa de fecundidad, existe un riesgo de alcance de equilibrio de trampa de ingresos medios y bajos a menos que se logre aumentos en la tasa de ahorro, la inversión y, por tanto, de la productividad.
Palabras clave: Dividendos demográficos, Crecimiento Económico, Razón de sustento económico.
I. Introduction
Latin-American countries are going through their demographic transition, which results in a gradual aging of the population. This phenomenon leads to a decrease in the number of children, an increase in older adults and, in general, a trend to stabilize their population structure. The demographic transition has affected all countries in the region, but the timing and pace have been different. According to Rofman and Apella (2020) fertility and mortality decline started early in the 1900s in some countries, including Argentina, Brazil, Cuba, and Uruguay with fertility rates equivalent to those of the replacement level, but began decades later in others with fertility rates somewhat higher than the replacement level, but with a decreasing trend. These variations resulted in significantly different age profiles across the continent, with some countries now completing their demographic transition while others are still in the early stages.
Although the demographic transition is related to variables that go beyond the economic sphere, there is an interaction between economic and demographic variables that is a source of opportunities and challenges in terms of economic growth. Recent empirical literature (Albrieu and Fanelli, 2013; Mason, 2005; Mason and Lee, 2006 and 2007, among others) suggest that while the demographic bonus stage --a period during which the share of the working-age population and the population with saving capacity in the total population is at its highest levels-- is characterized as the most favorable for economic growth, the aging period can be a source of constraint and even of macroeconomic instability.
From this perspective, one of the challenges faced by the countries of the region is to maintain sustained growth rates of GDP per capita once the aging stage has been reached. In other words, the challenge for Latin America is to “get rich before it gets old”.
This concern is based on the traditional argument that economic growth is a function of labor and capital endowments, both physical and human, plus a residual component commonly known as total factor productivity. Therefore, once the aging stage has been reached, a reduction in the size of the active-age population would limit the growth capacity of the GDP per capita.
However, before reaching the aging stage, countries have a great opportunity defined by the demographic bonus. This bonus is the period during which the share of working-age population and population with saving capacity in the total population is at its highest levels, because the decrease in the proportion of children is faster than the increase in the proportion of the elderly. As fertility rates decrease, countries may benefit from two types of demographic dividends (Lee and Mason, 2006). First, as the fertility rate declines, the child dependency ratio decreases while the percentage of working-age population increases. This constitutes a great opportunity in the short term as countries reach their maximum labor-force levels, which results in increases in the GDP and potential savings. As changes in the age structure increase production and resources, a “second demographic dividend” may arise due to accumulated savings, which would lead to a greater rate of investment in human and physical capital. The latter is the channel through which increased productivity can be achieved once the aging stage has been reached. The positive effects produced by the first dividend (the contribution of a greater workforce to the product) are temporary, while the second dividend leads to long-term benefits that come to fruition through a larger increase in productivity and sustainable development.
Therefore, if the demographic transition is a driving force for economic growth, it is likely that it will begin to stagnate after the end of the demographic bonus. If the second dividend is not materialized or other sources of economic growth do not emerge, such as increases in total factor productivity, it is possible to consider a middle-income trap equilibrium caused by demographic dynamics.
This process could be explained by the endogeneity that exists between the economic and demographic variables. As the first dividend is materialized and the GDP per capita grows, the economy requires a greater human capital to absorb and learn the new production technologies. This phenomenon raises the cost of investment in human capital, encouraging a fall in fertility and exhausting the demographic bonus. Mason et al. (2010) show that, for Asian countries, this level of investment is negatively correlated with fertility given the quality-quantity ratio.
This trade-off is based on the optimization exercise carried out by households and proposed by Becker (1960) and Galor (2011), among others, with the exception that here the effects of the economic growth is incorporated into the household decisions making process. If economic growth requires too high costs of investment in human capital --and fertility has a high elasticity-- this may be too low to sustain the support ratio and economic growth in the long term.
In this sense, it is possible to conjecture that if fertility is defined by the level of development of an economy and the speed of economic growth is conditioned (positively) by the support ratio, then economic growth leads to a low fertility rate, low support ratios and, therefore, a slow or null growth of GDP per capita in the long term.
In this context, the objective of this paper is to analyze the contribution of the first demographic dividend to the economic growth of Latin-American countries and to explore the possibility of materializing the second demographic dividend in the long term. Likewise, an attempt is made to have a better understanding of the relationship between fertility, economic growth and human capital cost decisions, in order to have an approximation to the risk of achieving the medium and low-income trap equilibrium.
As it was previously mentioned, different studies have analyzed the relationship between demographic and economic variables for various countries in the world. The present work attempts to contribute to this discussion by formulating an economic growth model, deriving and explicitly specifying as explanatory variable the support ratio for a group of Latin-American countries.
The next section discusses the relationship between demographic changes and their impact on economic growth. The third section present an exercise of factorial decomposition of growth and estimate some specifications of the production function in order to identify the relevance of the role played by demography. In the fourth section, the medium/low income trap equilibrium hypothesis is tested. Finally, some final thoughts are presented.
II. Demographic dividends and economic growth
Following the pioneering analysis developed by Mason and Lee (2005), the effects of the demographic transition on the economic growth process are related to what these authors call the first and second “demographic dividend”. According to these authors, during the stage of the demographic bonus a window of demographic opportunity is generated, characterized by favorable conditions to boost economic growth. The so-called demographic dividends are, precisely, the most remarkable manifestations of the changes caused by the demographic transition on the expansion of economic activity.
The first dividend occurs when the share of the working-age population in relation to other age groups increases. As a result, the increase in the GDP per capita is favored. Nonetheless, this first dividend disappears or is even reverted when the population aging stage starts, as the share of the dependent in the total population begins to increase. As a result, the first dividend is a transitory phenomenon.
The second demographic dividend takes place because there is an increase in the share of the population that can be considered “prime savers” (their levels of disposable income exceed their consumption expenditure) during the first dividend period. This situation leads to an increase in the economy’s savings rate, which can be used to increase investment in physical and human capital per worker and, thus, increase productivity once the aging stage has been reached. As a result, the second dividend yields long-term benefits through increased growth in production and sustainable development.
Demographic transition is far from being a neutral process regarding the dynamics of economic growth. The absence of neutrality is associated, precisely, with the two dividends. The first one affects the labor factor availability, leading to conditions that favor economic expansion during the demographic bonus period. In turn, the second dividend acts on the saving conditions of the economy, indirectly affecting the capacity to invest and accumulate physical and human capital, as well as, total factor productivity. Although the impact of the second dividend falls directly on the conditions for capital accumulation, given that the dynamics of total factor productivity is closely associated with the accumulation of capital and the realization of improvements in the educational levels of the population, an additional effect of this second dividend is expected through total factor productivity.
As an example, the countries known as Asian tigers, which have begun the demographic transition a few decades before Latin America, have been treading a path of economic growth for several decades. According to Ha and Lee (2016), a significant part of this growth was associated with demographic dividends. However, it is not certain that this growth path will be maintained over time in all Asian countries because the magnitude of the demographic dividends is different by country. If the demographic transition is a driving force of economic growth, it is likely that it will begin to stagnate from the end of the demographic bonus and will require the promotion of other sources of economic growth. As the support ratio, that is, the working-age population as a percentage of the total population, begins to decline, this could become a concern.
Young (1995) argues that the miracle of Asian tigers is mainly due to the accumulation of productive factors. From the point of view of demographic dividends, this accumulation is largely due to the changes that take place during the demographic transition, particularly the faster growth of the working-age population in relation to consumers. In short, this directly increases the economic contribution, while the second dividend - increase of savings and investment with wealth accumulation, makes the physical and human capital per worker increase and with it the productivity.
Deaton and Paxson (1997) and Lee et al. (2003) showed that the demographic transition in Asia increased the savings rate, which allowed the materialization of the second demographic dividend, which is playing an important role in the economic convergence with the rest of the developed economies.
In order to quantify the current state and trends of economic growth in Latin America, we adopt the growth accounting method to measure the contribution of each factorial component to the growth of the GDP per capita. To do this, we assume the following Cobb-Douglas aggregate production function:
-
-
-
-
-
-
Different authors (Aravena and Hofman, 2014; Loayza, 2008; Caselli, 2004, among others) carry out a growth accounting method in order to measure the contribution made by each of the productive factors. This type of exercises was primarily intended to understand the role played by the TFP. As an example, Aravena et al. (2015) estimate the contribution of each productive factor endowment and the TFP in the economic growth of the countries of Latin America. The results found by the authors suggest that by improving the specification of the explanatory variables of economic growth by incorporating the number of working hours, the TFP (or the residual component) loses relevance in its contribution to growth.
However, there are no previous studies for the Latin America that, through these types of exercises, attempt to quantify the contribution of demography. In this sense, applying some algebraic procedures in equation (1) it is possible to have a more detailed specification of each productive factors, especially of the labor endowment and its characteristics such as its quality and age structure.
Dividing (1) by the size of the population (N) and multiplying and dividing by the size of the working age population aged between 15 and 64 years old
Where
The sources of information used in the present paper are the following: the GDP data and the stock of physical and human capital come from the Penn World Table 9.0, which has been collected for international comparisons12; demographic information comes from the Population Division of the United Nations, while spending on education, savings and investment rates comefrom the economic development indicators developed by the World Bank. With this information,we built a panel of 16 countries for years 1960-2014. Figure 1 shows, for a set of selected countries, GDP per capita between 1960 and 2014.
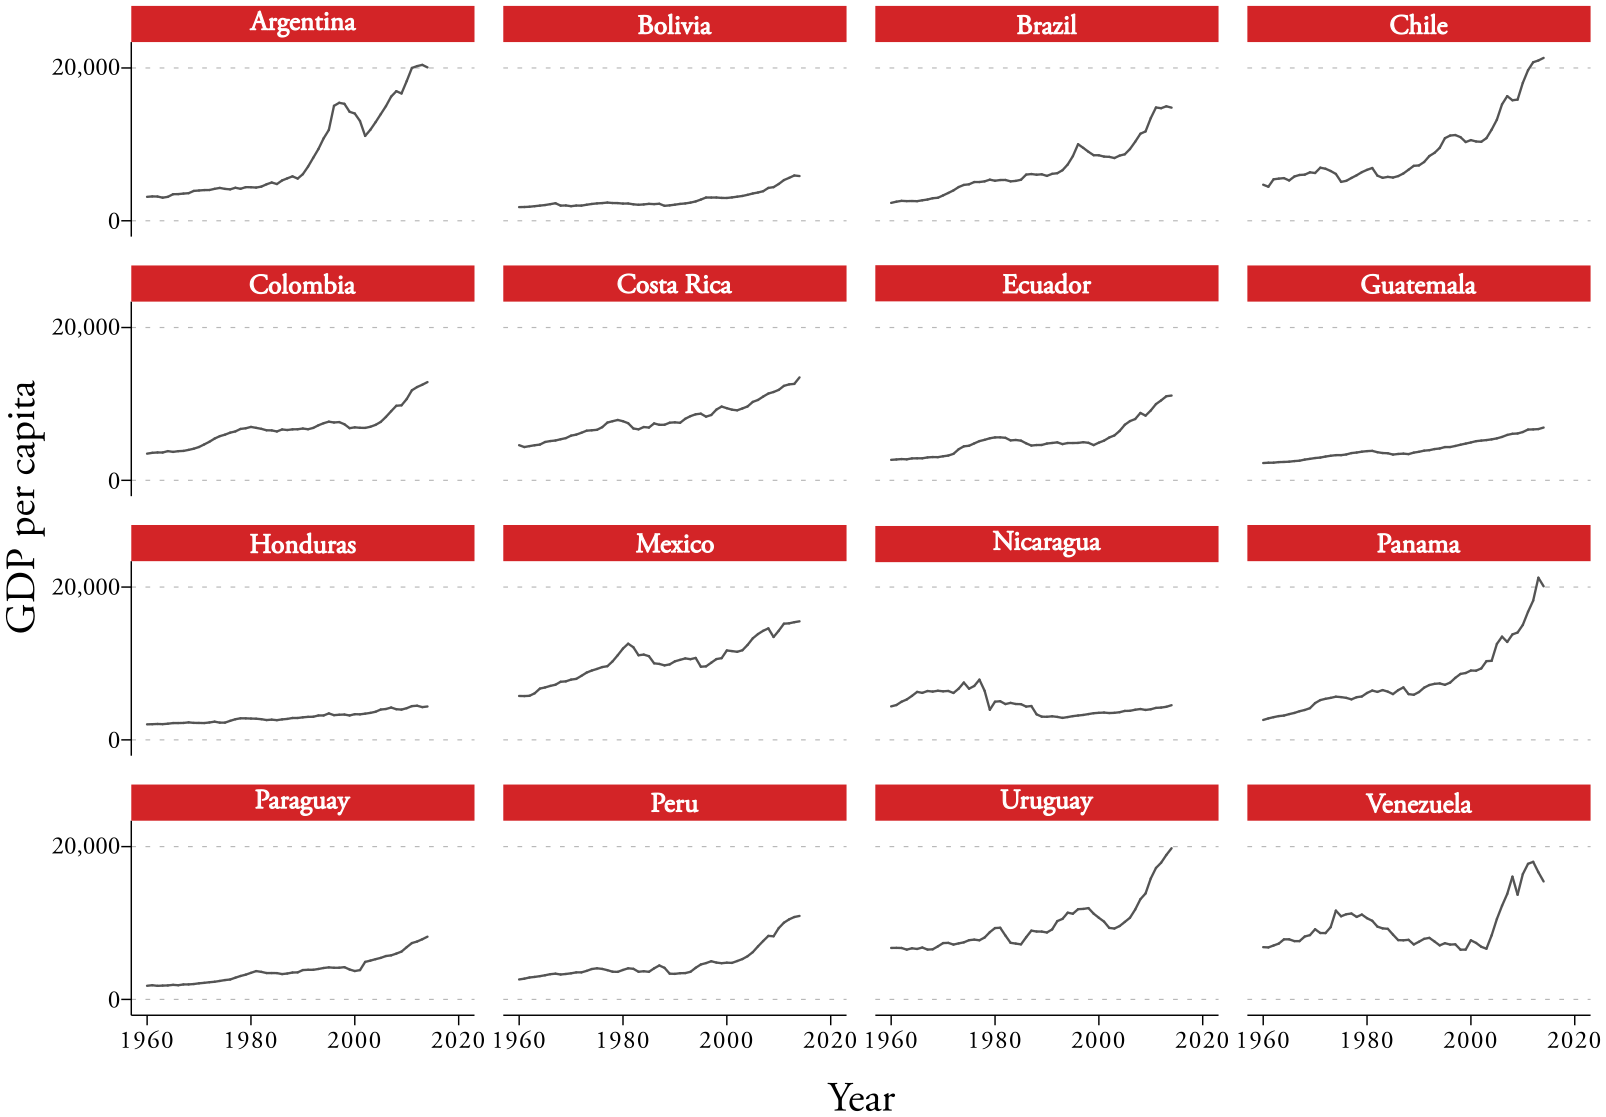
Source: Penn World Table 9.0
In general, countries of the region, with some exemption such as Honduras, Nicaragua and even Bolivia, show a growing trend in the GDP per capita during the period under analysis. Beyond the macroeconomic volatility that characterizes the region, the trend of the GDP is growing, particularly since the 90s. In this sense, the average annual growth for selected countries is 2.3%. Panama stands out (3.7%), follow by Argentina (3.5%), Brazil (3.4%) and Chile (2.7%).
In order to obtain a first approximation of the importance of the demographic dynamics on the growth of the GDP per capita, Figure 2 presents the support ratio by country between the years 1960 and 2014.
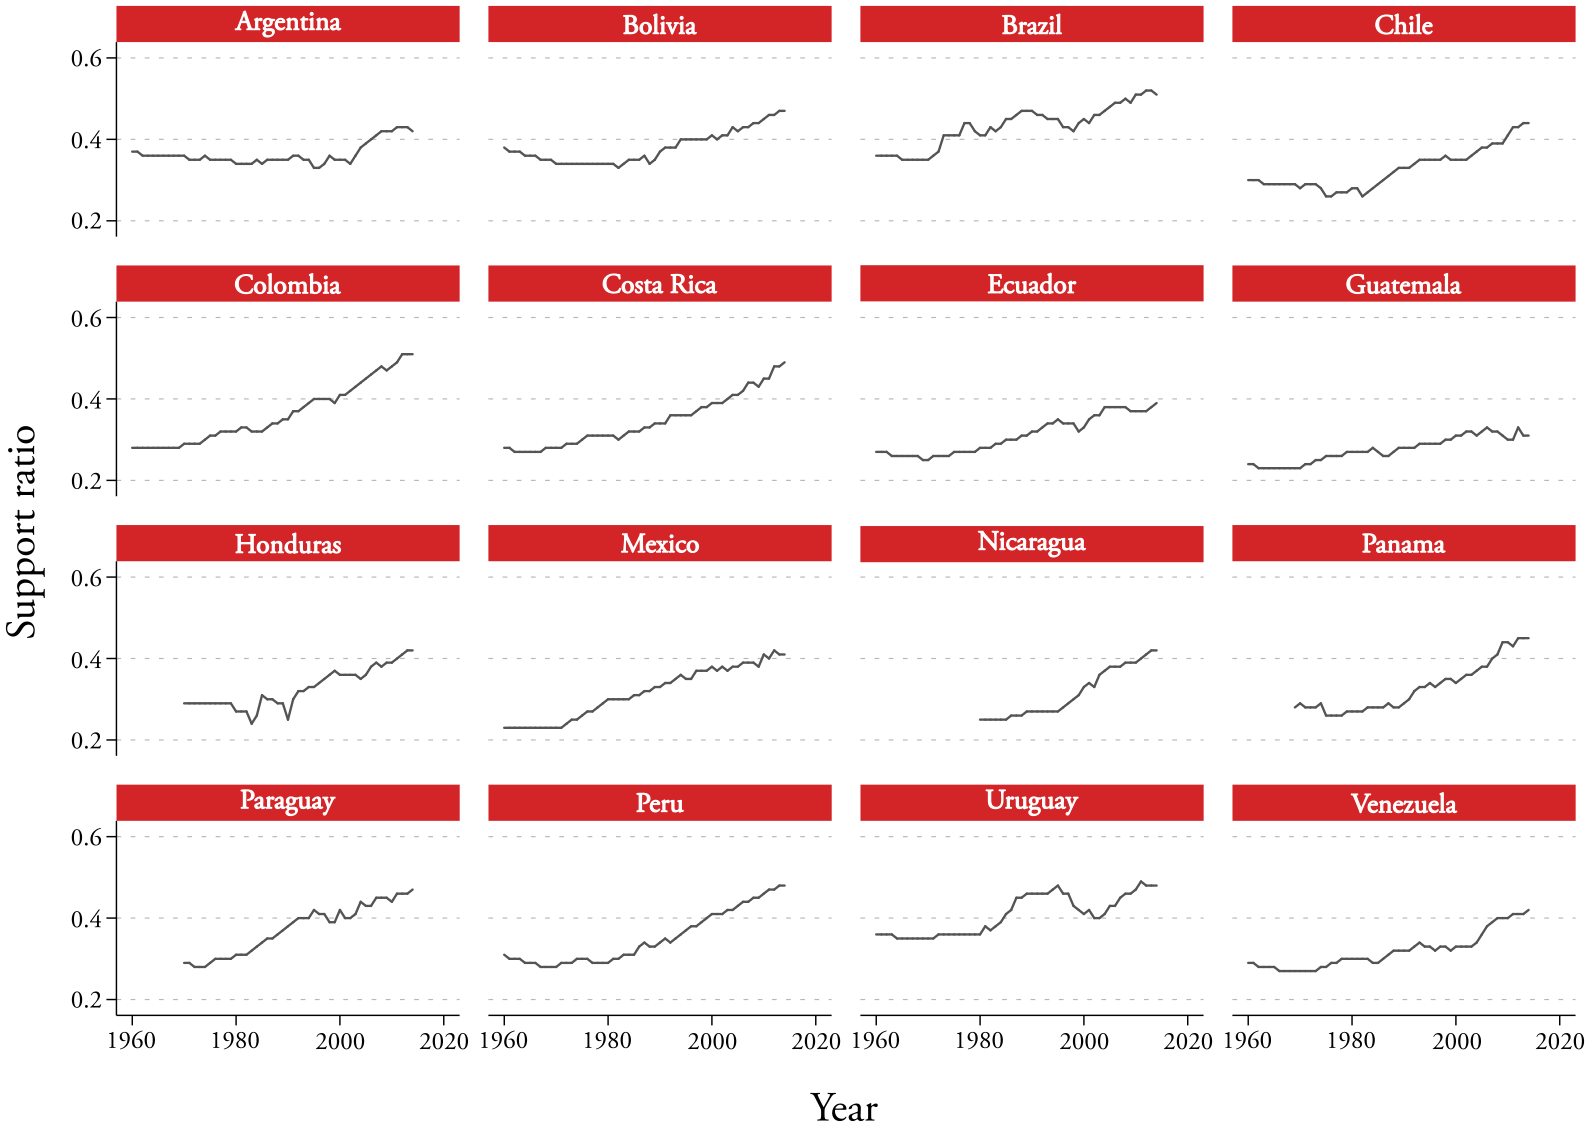
Source: own elaboration base on Penn World Table 9.0 and Population Division, United Nations
Data suggests that the region as a whole is going through a good opportunity to maintain positive economic growth rates, while the support ratio shows an increasing trend during the period under analysis. This fact is associated with the process of demographic transition that the region is going through, which implies a gradual reduction in the proportion of children and the labor activation of people who are part of the “babyboom” that took place at the end of the "'70s" and early "'80s". In the next section, we will present an economic growth accounting exercise and the estimation of some expression in order to get a better understanding of the relevance of the demographic bonus on the economic growth.
III. Economic growth accounting method
One of the main hypotheses of this analysis is that the rhythm of economic growth is closely related to the support ratio of each country. So, the direct effect of changes in the demographic structure on the speed of growth is measured to then consider the overall effects.
The rate of economic growth can be measured by growth rage of the GDP per capita, which has been discussed in the previous section. This rate can be decomposed into the variation of each of its components. Taking logarithm and differentiating with respect to time the equation (2), it is possible to decompose the speed of growth in the following way:
Where
Regarding the importance of the support ratio, its contribution has been, on average, 20% for most of the countries, which is as important as human capital or education. However, its contribution is not constant over time and lasts no longer than two decades. This is precisely associated with the transitory nature of the first demographic dividend, in which the population dynamics by itself allows to go through a period in which the highest proportion of the active population (the lowest proportion of the dependent population) is observed.
However, changes in support ratio also affect the savings and investment level of countries, which ultimately affects the growth rate. When a country is transiting its demographic window of opportunity, as the size of the cohorts in working age increases, the proportion of “prime savers” rises. That is, the proportion of people who, due to their age, are characterized by a high propensity to save due to the higher incomes in relation to their consumption. Therefore, a greater share of this group implies a greater propensity to the economy to save. Likewise, if life expectancy rises, the stock of assets necessary to finance a longer retirement period increases and this would demand a higher level of savings. A higher level of savings allows the financing of a higher level of investment and, therefore, a rise in the productivity in the medium term.
According to the traditional theory of economic growth, the speed of convergence in GDP is determined mainly by the relative state of the country: a poor country grows faster and a country with a higher GDP per capita does so more slowly. However, this simple argument, known as “absolute convergence” has not been compatible with empirical results. It is possible to modify this argument by adding some variables such as the investment rate, in which it is possible to corroborate the “conditional growth” hypothesis. To do this, we formulate the following expression to test both absolute and conditional growth.
Where x are investment rates and other relevant variables. According to Nelson and Phelps (1966), x can include the level of human capital because it is needed to adopt and adapt new production technologies that have been created by developed countries.
In addition, it is possible to consider the support ratio within the set of explanatory variables of the growth rate of GDP per capita, since an increase in the support ratio enables households to have greater savings capacity and invest in human capital of the family members (in the form of education and health expenditure). Moreover, in a macroeconomic perspective, a higher support ratio also allows governments to increase spending on human capital per person as the relative importance of social assistance spending is lower. Such increased investments for the future due to higher support ratios can be regarded as a kind of the ‘‘second demographic dividend,” which can expedite the process of learning and investment needed for a faster economic growth.
In order to stablish the importance of the demographic bonus on the savings and investment capacity of the Latin-American economies, we estimate the savings, the investment rate, and the level of public expenditure on education as a function of the support ratio. Results are presented in Table 1.
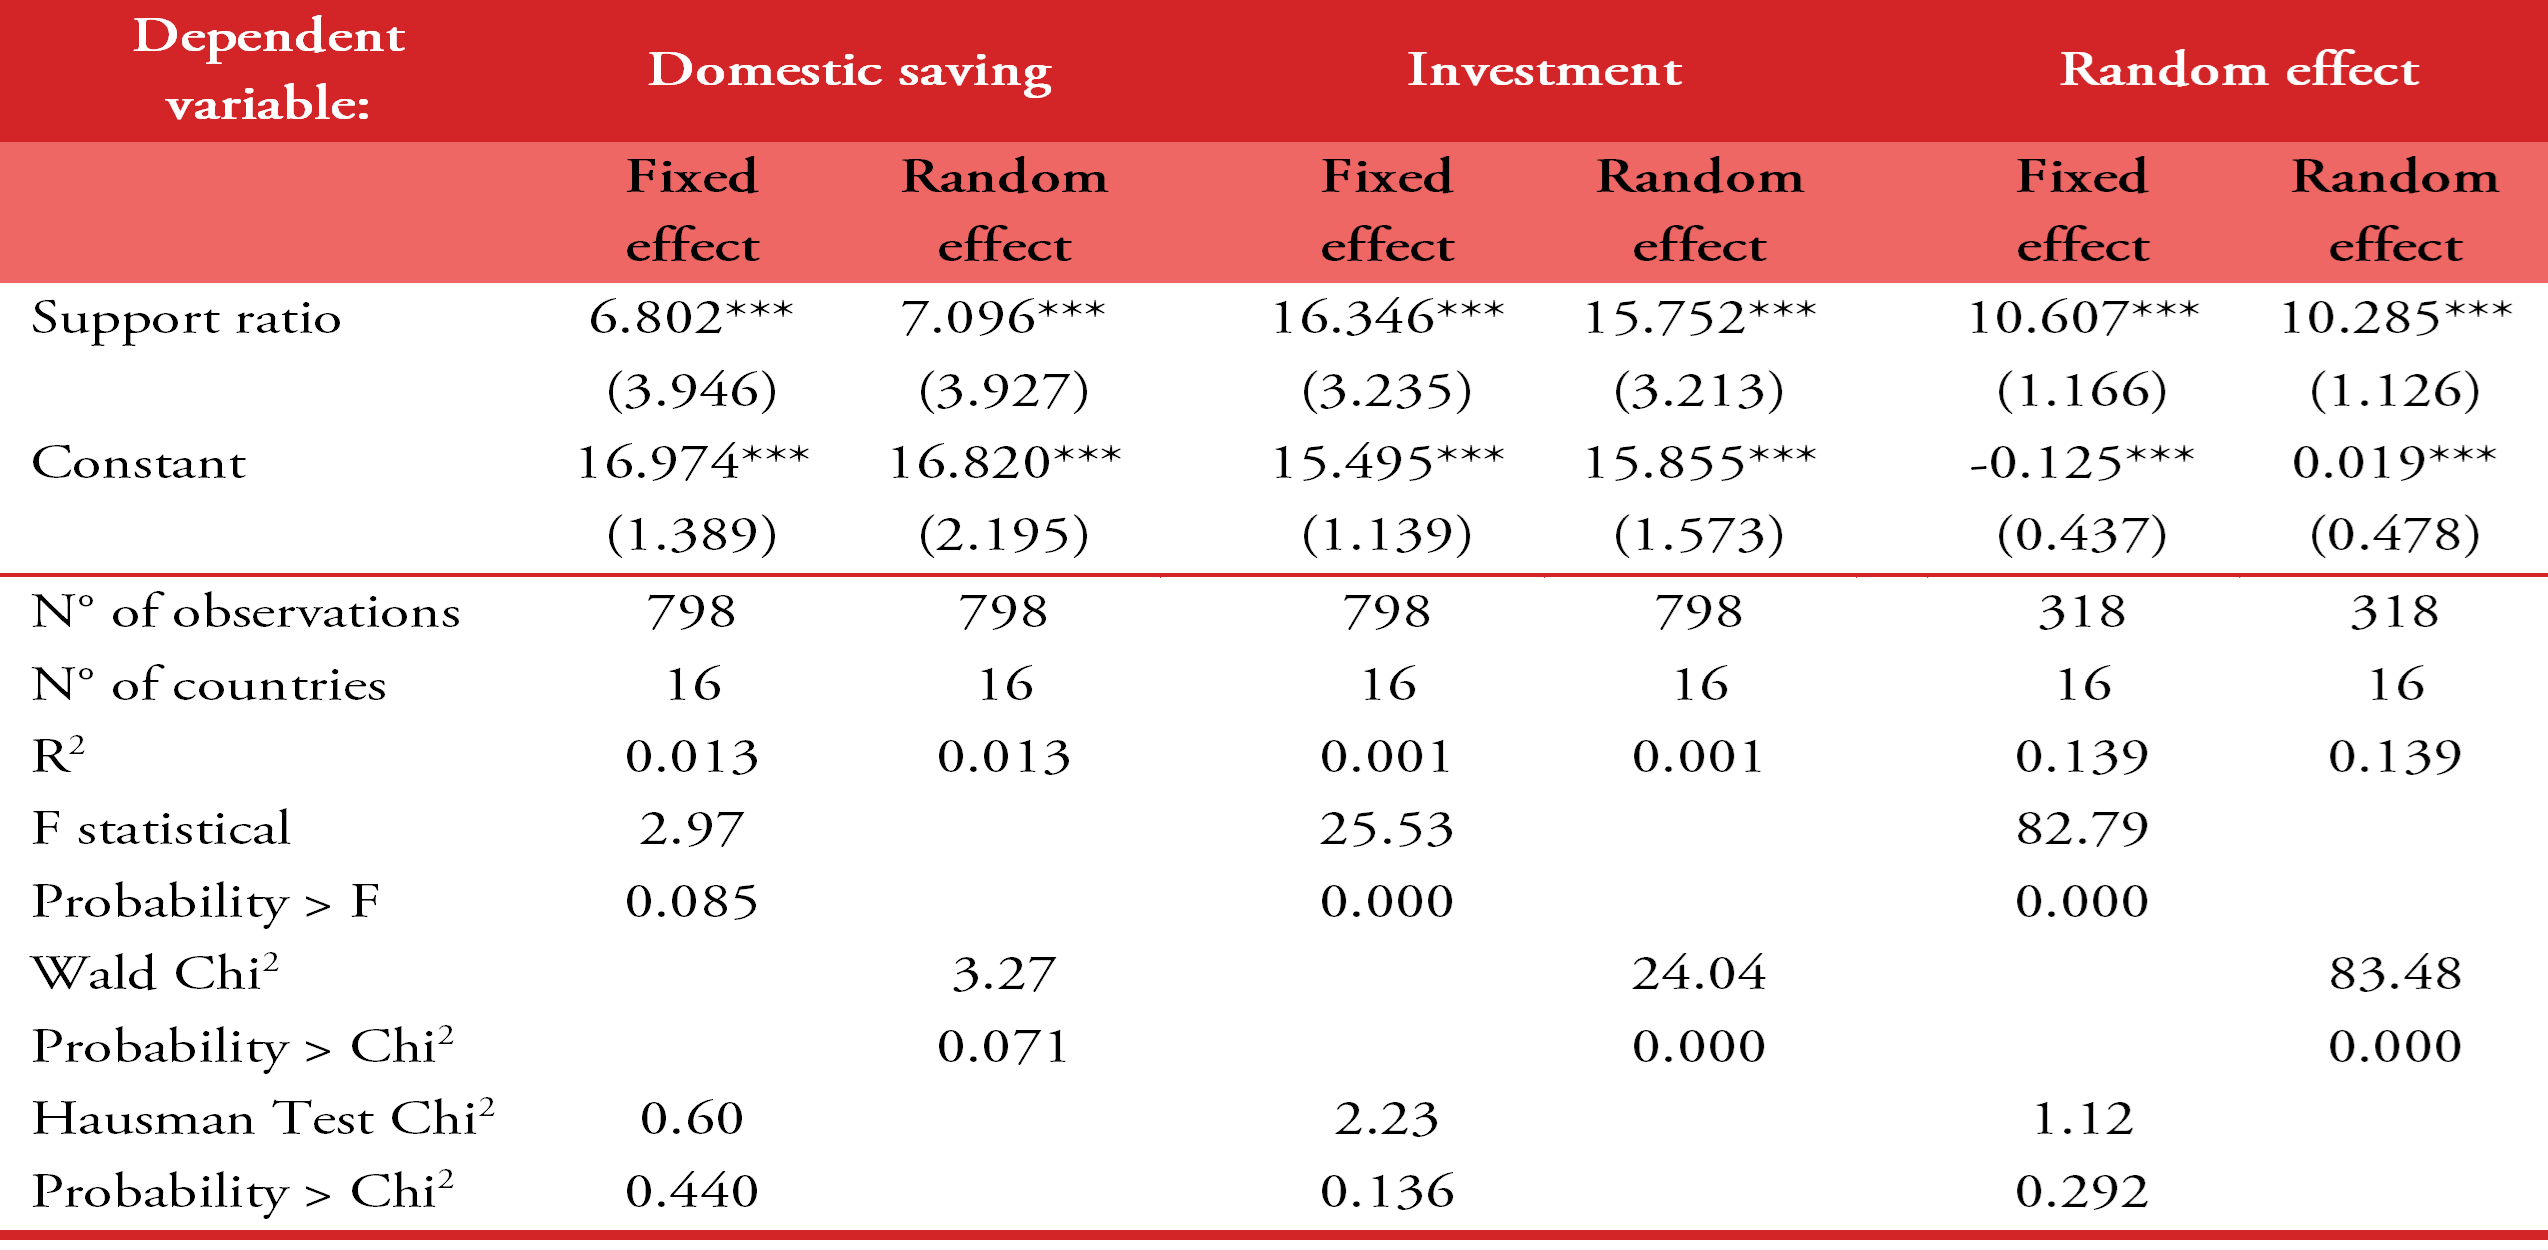
Source: own elaboration base on Penn World Table 9.0, Population Division, United Nations, and World Bank, World Development Indicator.Note Saving, investment and public expenditure in education are in term of GDP
Number in parenthesis are standard errors, *** significant level at 1%, ** at 5%, * at 10%.
Variables are in their level.
We estimate two models by applying fixed and random effects. The objective of the two models is to identify the presence of correlation between those variables specific to each country --not observable by the econometrician-- and the explanatory variables of the model. In case of such a correlation, the model that best adjusts is the one with fixed effects, while, in the opposite case, the model with the best adjustment will be the one with random effects. The result obtained by the Hausman test does not reject the null hypothesis of absence of correlation in the first model at 95% confidence, concluding that the model with random effects is the best specification.
Results suggest a positive and significant correlation between the support ratio and the three considered variables: savings, and investment in physical and human capital, measured through public expenditure on education. These results highlight the importance of the demographic bonus --through investment not only in physical capital but also in human capital-- to increase the productivity in the medium and long term of the region economies. However, the levels of savings maintained by countries (with some exceptions) are at relatively low levels compared with those observed, for example, in Asian countries (figure 3). This low saving rate implies a future challenge for the region to reach the second demographic dividend, that is, to get rich before getting older.
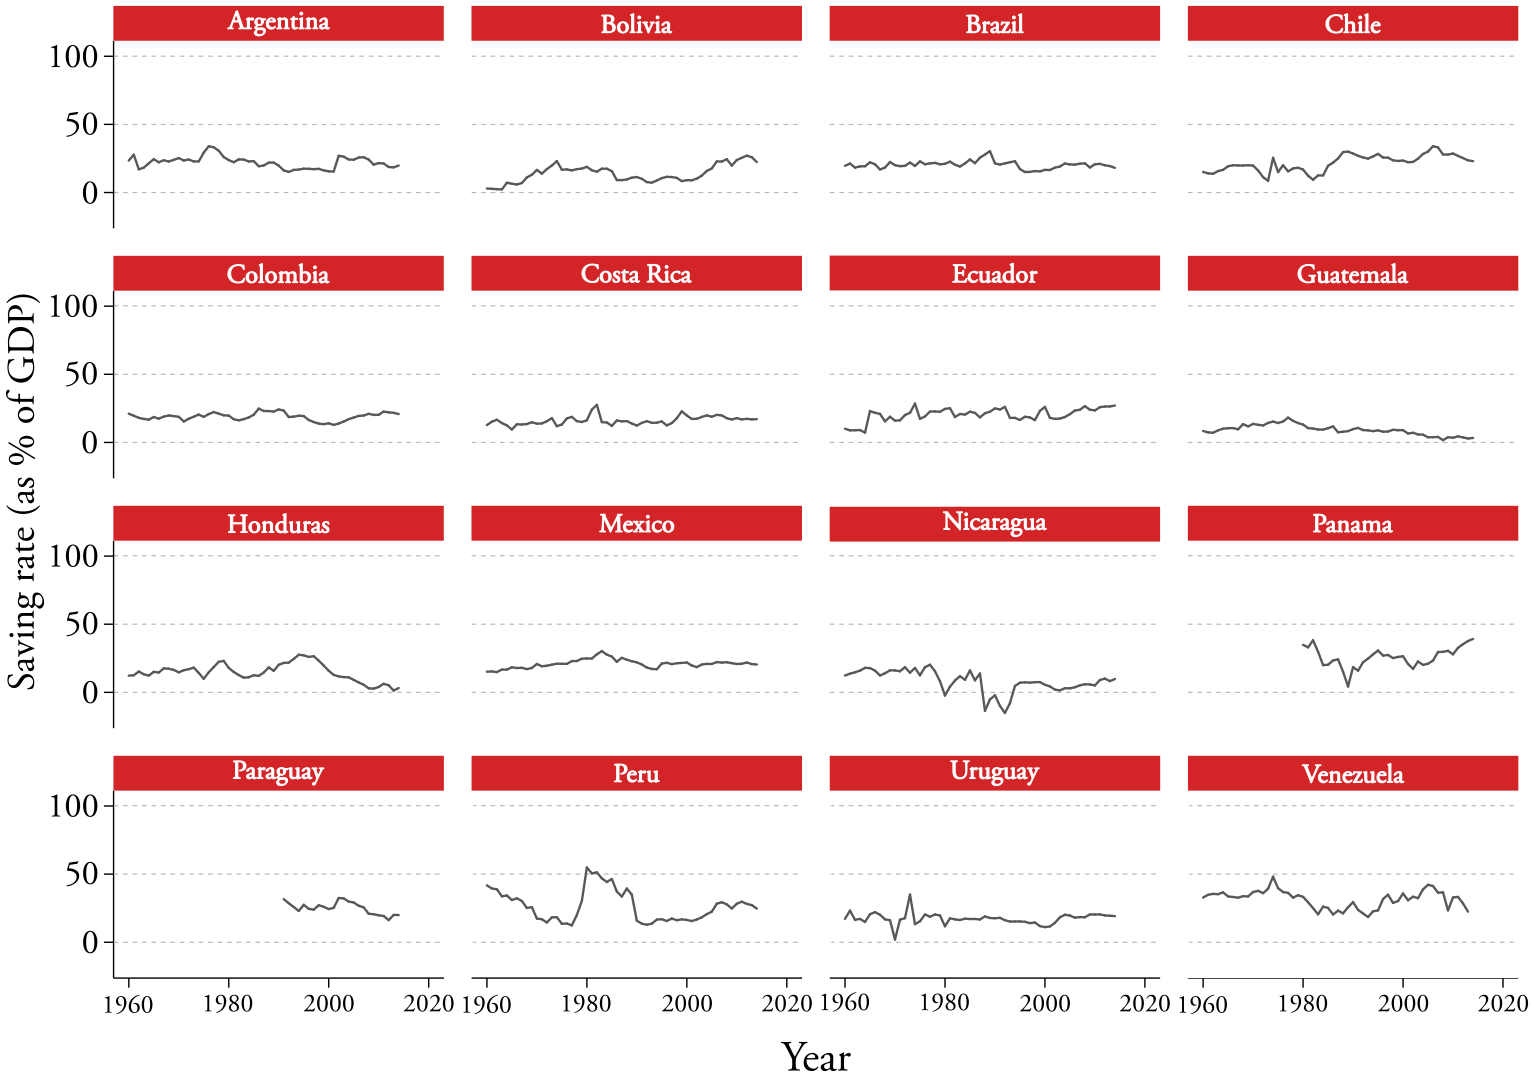
Source: Penn World Table 9.0
In average for the selected countries and the entire period under analysis, the savings rate is 19% of GDP, with a great dispersion not only over time but also between countries. In 2014, Panama (39%), Ecuador (27%), Peru (24%), Chile (23%) and Colombia (20%) stand out as the countries with a savings rate higher than the regional average.
Figure 4 presents income and consumption per capita profile by age (expressed in terms of the average income of people aged between 30 and 49 years old) for selected Latin-American countries, that participate in the National Transfer Accounts project, and Republic of Korea. The evidence shows similar profiles in all countries, identifying three clearly differentiated stages according to whether the income level is lower or higher than consumption: a level of zero income in childhood, increasing from a certain age in youth and decreasing in some moment at old age. On the other hand, consumption presents a relatively constant pattern at every age, with a slight increase in the older ages associated with a higher expenditure in health.
One important characteristic of these figures is not only the ages where individuals have a surplus and therefore saving capacity, but also the intensity of the surplus, that is, the distance between labor income and consumption. In terms of the duration of the surplus period, Colombia is the country that has the largest number of years (39) among which individuals have a life cycle surplus, between 22 and 61 years. Then follows Chile (36) and Argentina (33). However, Colombia and Chile have a greater surplus “area”, that is, a greater distance between income and consumption, which implies that, given their consumption and income profile, they have greater individual savings capacity. These countries are facing a very favorable demographic and economic scenario, as not only the temporary window through which individuals are surpluses is extensive, but also because the level of such surplus is higher than that observed in their neighbors and similar to the one for Republic of Korea.
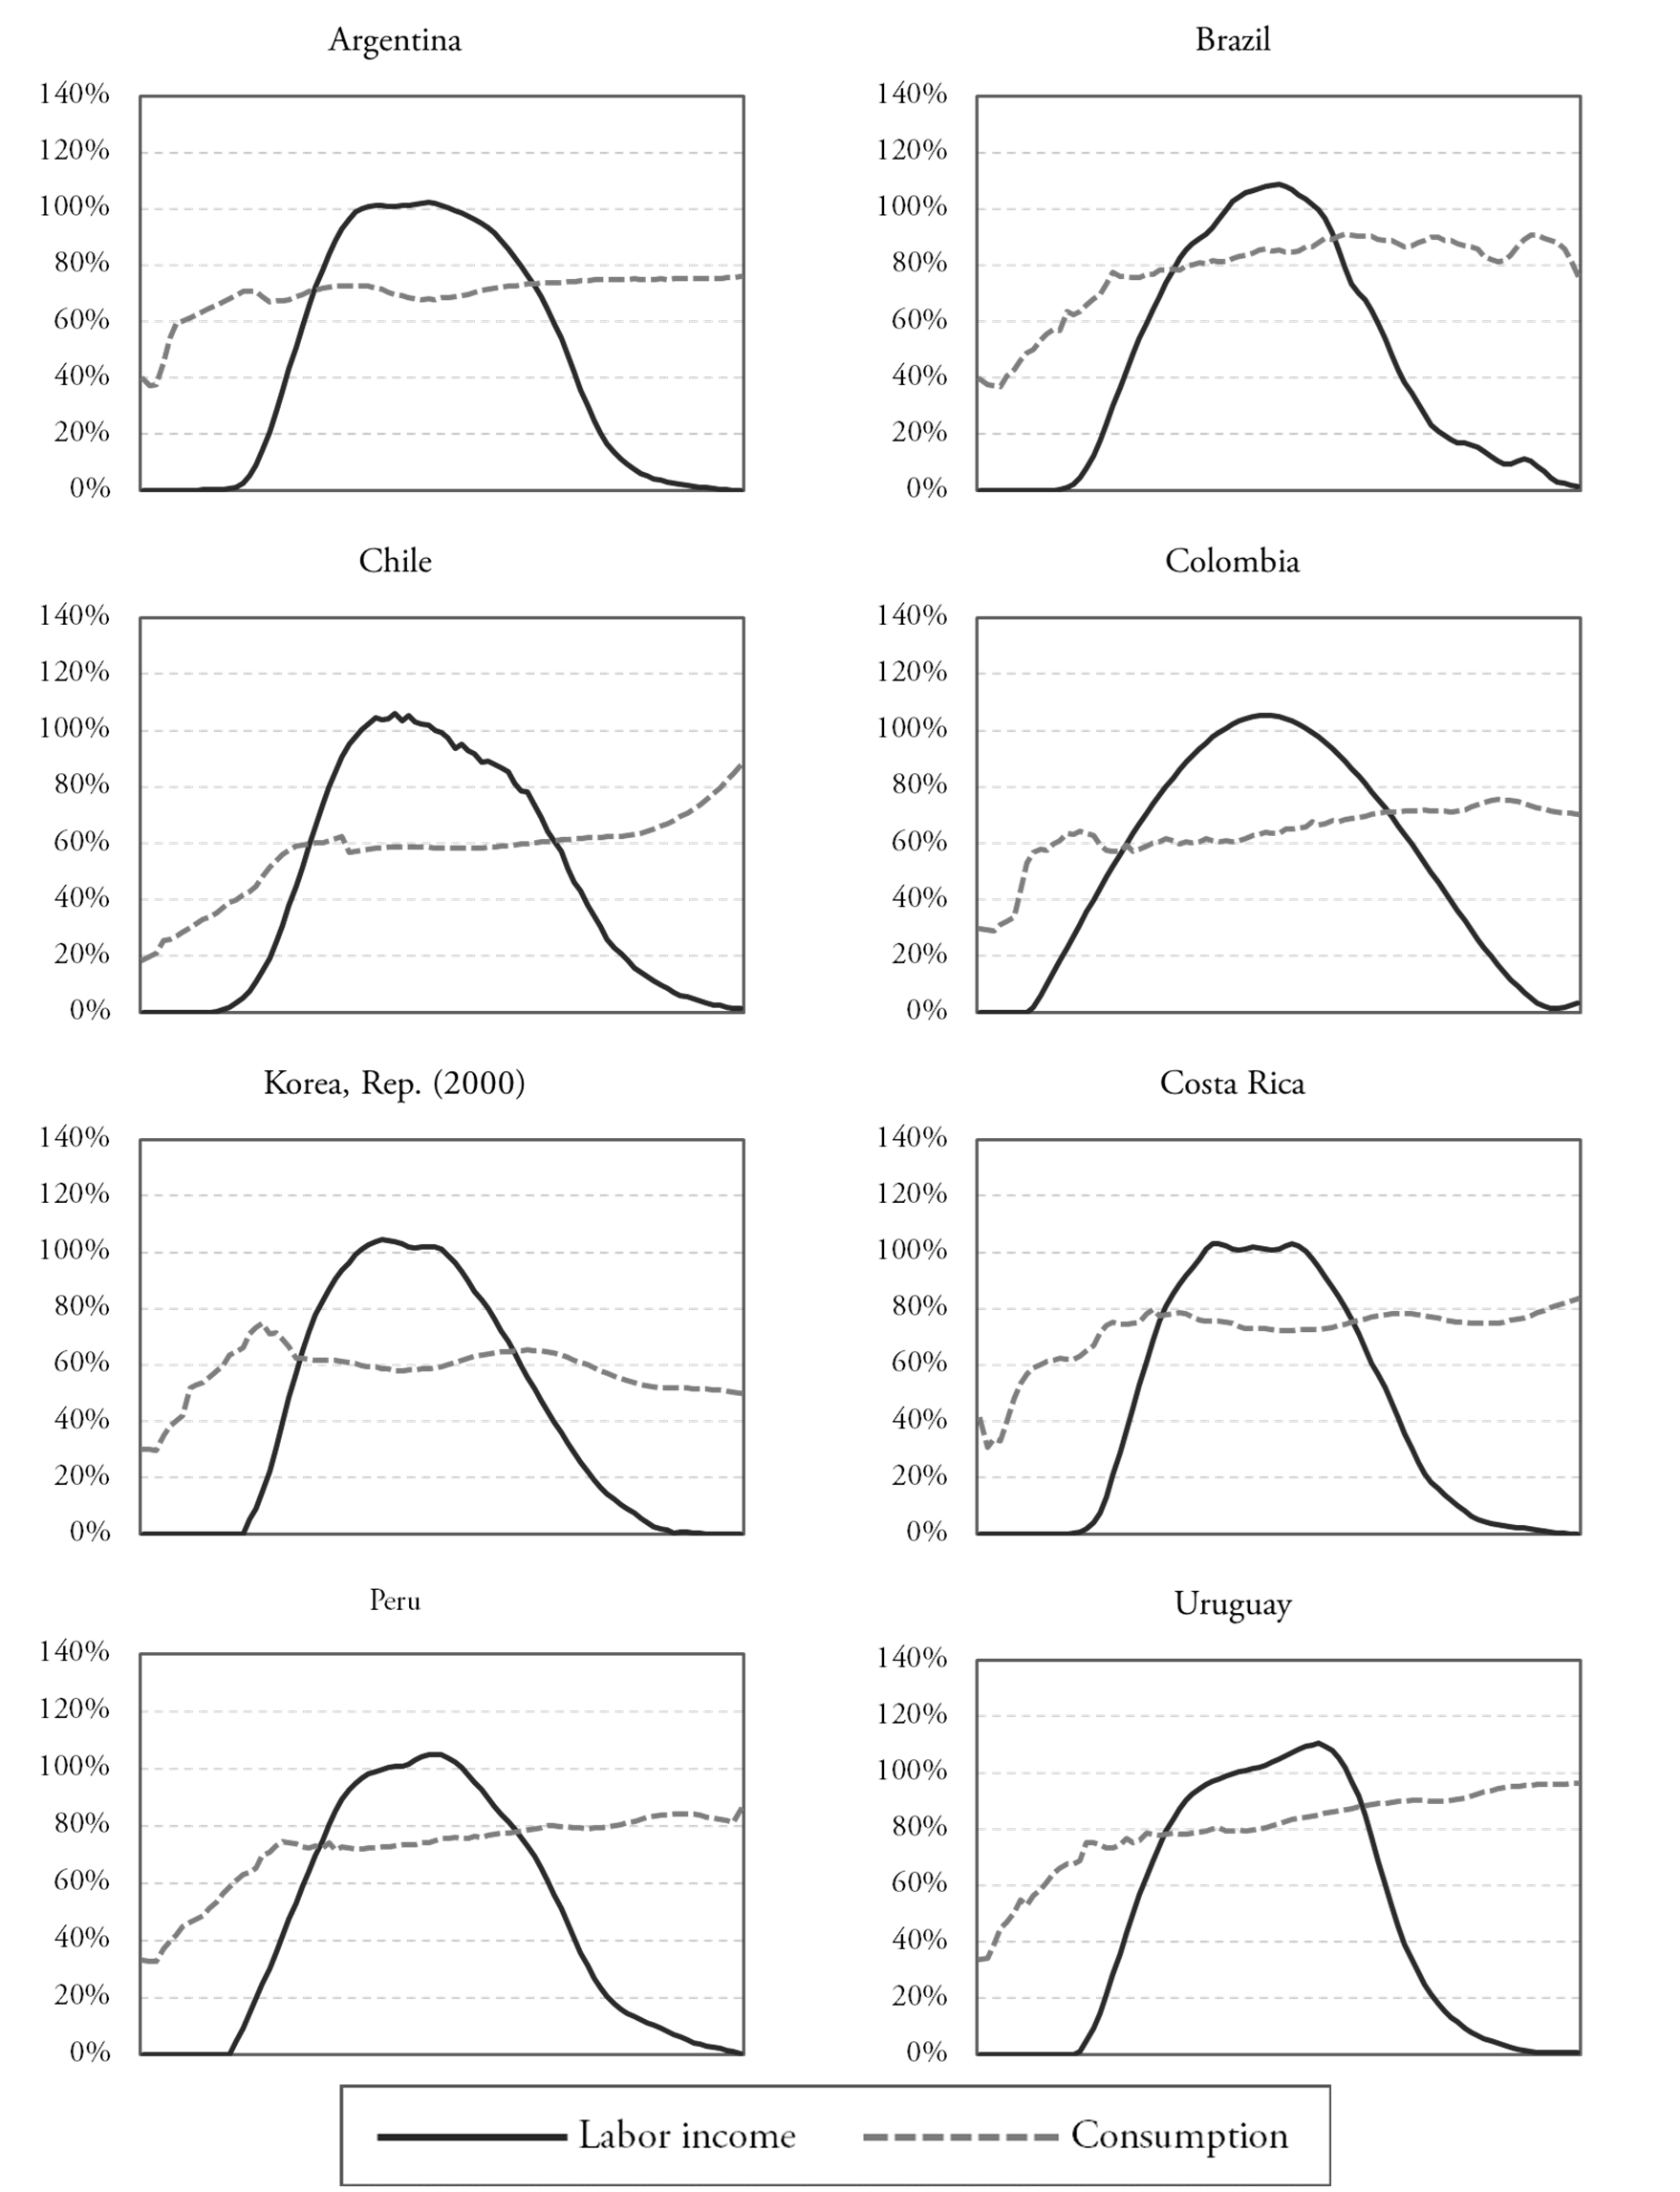
Source: Argentina, Comelatto (2015); Chile, Apella et al. (2019); Uruguay, Bucheli (2017); rest of countries, NTA Project (http://www.ntaccounts.org)
Results suggest not only a low saving rate in the countries of the region, except for Chile and Colombia, but also with significant constancy over time. These results complement the previous findings, related to the high propensity to consume in Latin-American countries and the low intensity of the life cycle surplus. In effect, Chile and Colombia have the highest intensities of the life cycle surplus and this makes possible, in part, the observed relative high savings rates.3
In this context, it is possible to suggest that Latin America has a great opportunity, but at the same time a great challenge. Low saving rates raise some concerns regarding the ability of countries to take advantage of the demographic bonus, accumulate capital during it and, thus, achieve an increase in productivity in the medium and long term. Given this trend in savings rates, it is evident that society will have to make greater efforts in the remaining years to achieve an advantage over it.
We
estimate equation (4), through a panel regression using two alternative
specifications related to the variables included in the vector . On the one hand, we
consider, in addition to the natural logarithm of GDP per capita, the
investment rate, the human capital index and the support ratio. On the other
hand, we include as a condition the support ratio. The sign of the coefficient
of the natural logarithm of GDP per capita,
We estimate two models by applying fixed and random effects. The objective of the two models is to identify the presence of correlation between those variables specific to each country --not observable by the econometrician-- and the explanatory variables of the model. In case of such a correlation, the model that best adjusts is the one with fixed effects, while, in the opposite case, the model with the best adjustment will be the one with random effects. The result obtained by the Hausman test rejects the null hypothesis of absence of correlation in the first model at 95% confidence, concluding that the best model is the one with fixed effects on countries, while the null hypothesis is not rejected at 95% confidence in the second model, with random effects being the best specification.
The results do not support the hypothesis of economic convergence that is, maintaining a low GDP per capita is not necessarily favorable for accelerated economic growth. In this sense, the sign of the natural logarithm of GDP is positive and significant, suggesting that it is more likely that rich countries have faster rates of economic growth.
With respect to the rest of the explanatory variables, in both estimated models, the support ratio presents a positive sign and it is significant at 5% and 1% in the first and second models, respectively. This implies that the demographic transition is a window of opportunity allowing a greater economic growth (first dividend), which can be used to generate an increase in the saving and investment rate and, thus, achieve productivity increases in the long term (second dividend). However, and as it was discussed previously, although the level of savings is significantly correlated with the support ratio, it is still relatively low compared to the Asian countries that have already experienced the transition.
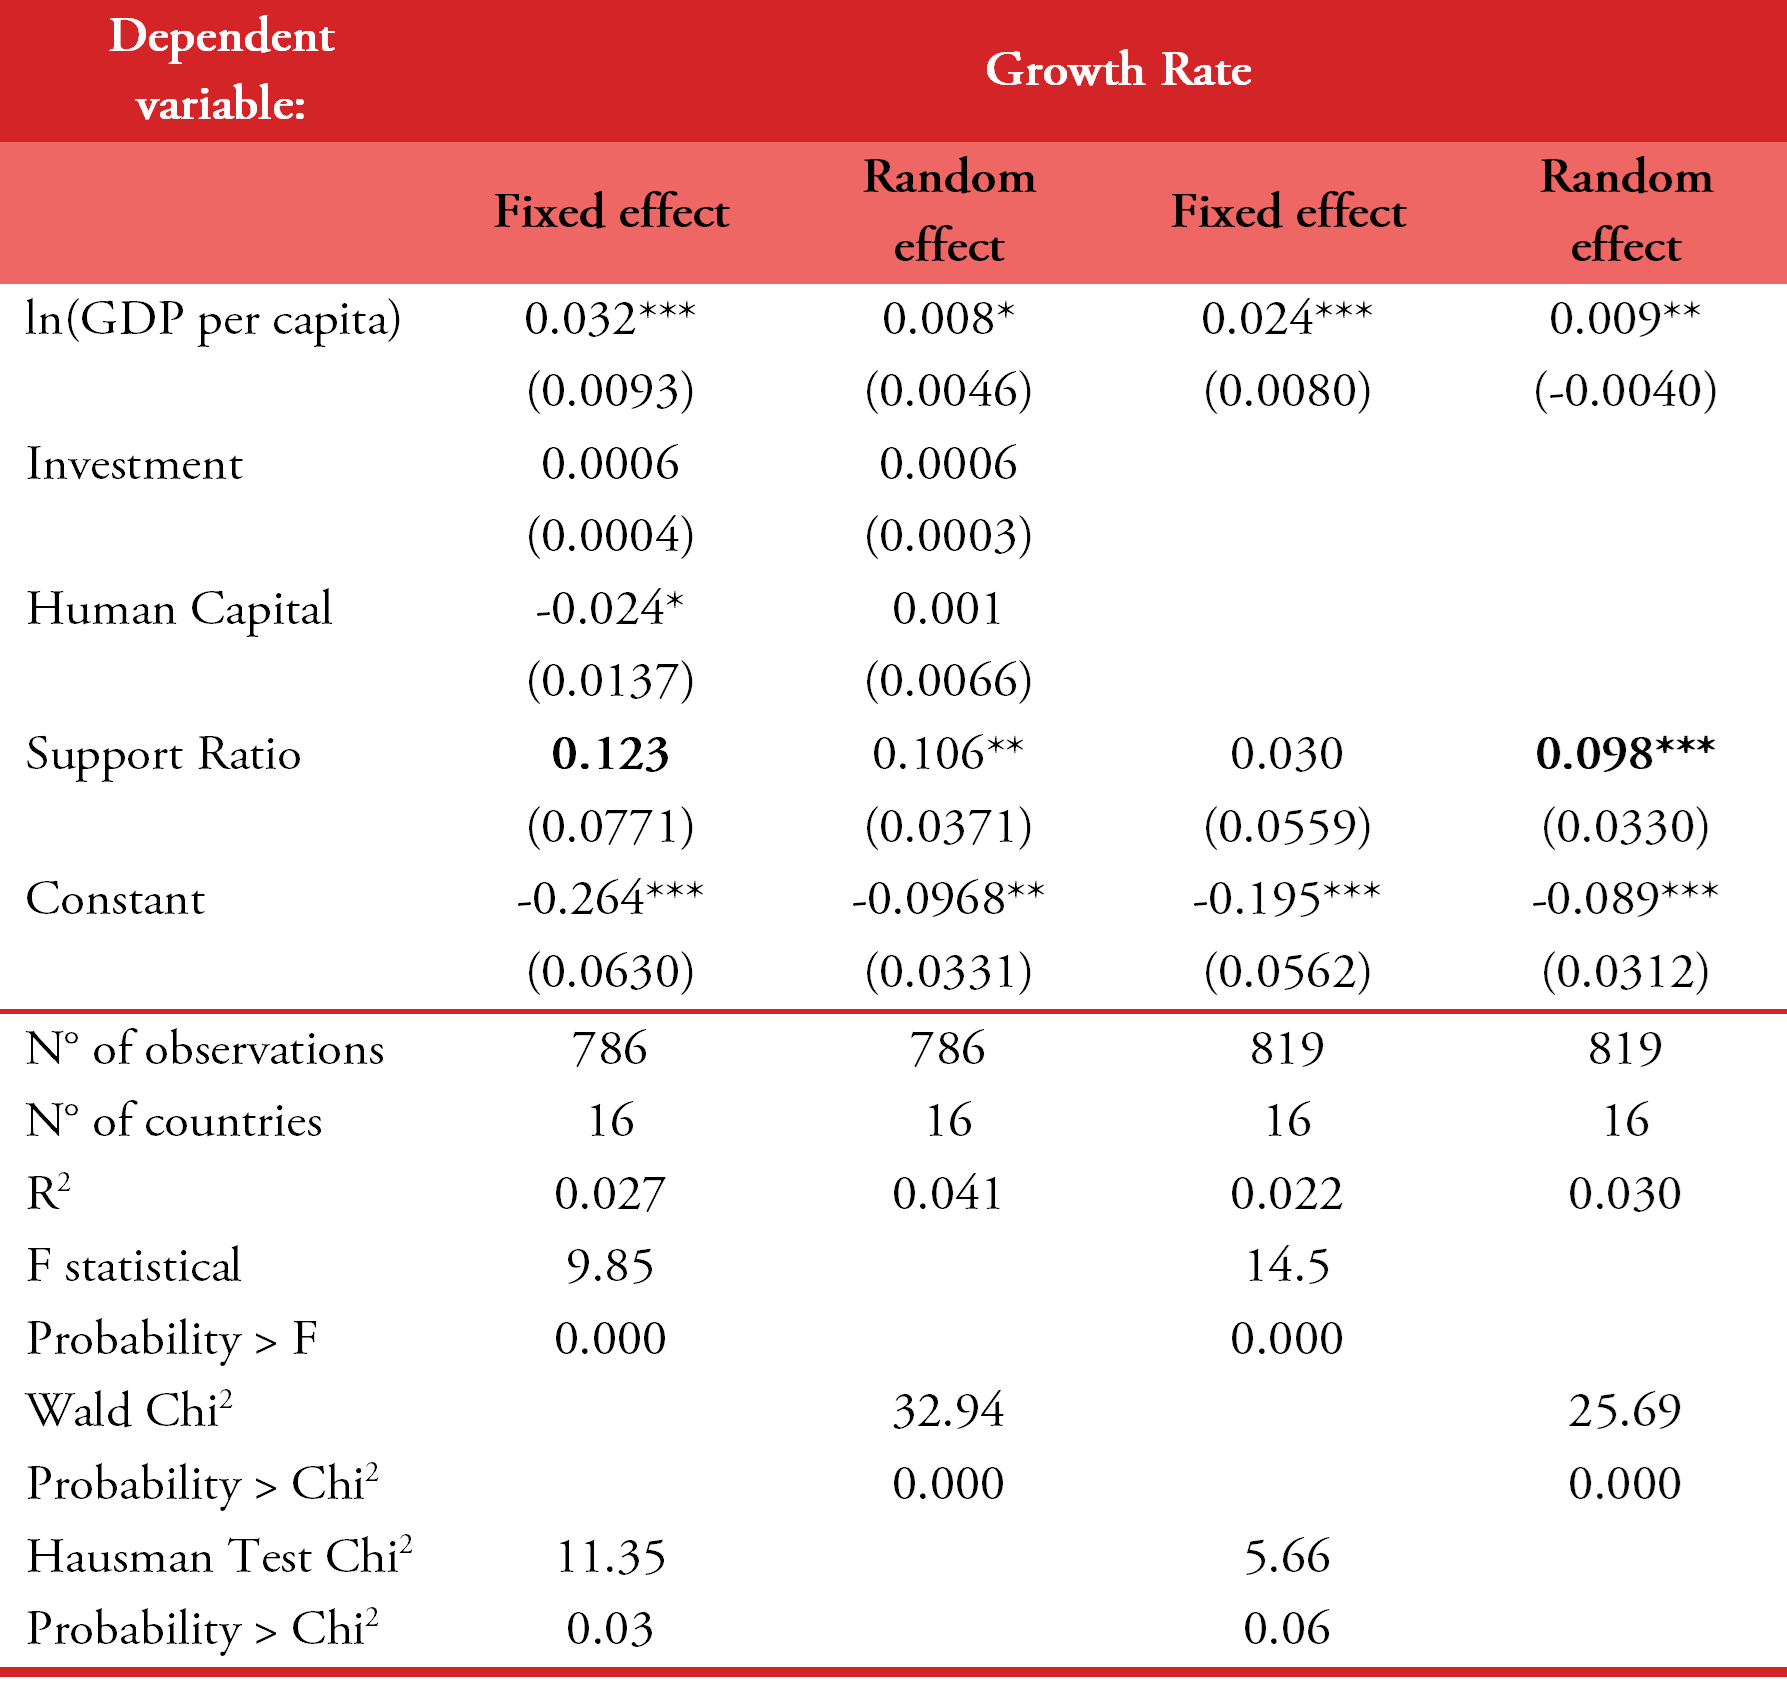
Source: own elaboration base on Penn World Table 9.0, Population Division, United Nations, and World Bank, World Development Indicator.Note: number in parenthesis are standard errors, *** significant level at 1%, ** at 5%, * at 10%.
IV. Low and middle-income trap due to low fertility
A high support ratio plays an important role in the economic growth of countries of the region. The increase in the support ratio was due to a fall in the fertility rate as can be seen in Figure 5 for 1960-2014. Currently, Latin-American countries have high support ratios together with an extremely low fertility rate. However, these low fertility rates will have a negative impact on the future support ratio, while in the medium and long term this will imply a reduction in the size of the working-age populationas the size of the elderly population will increase.
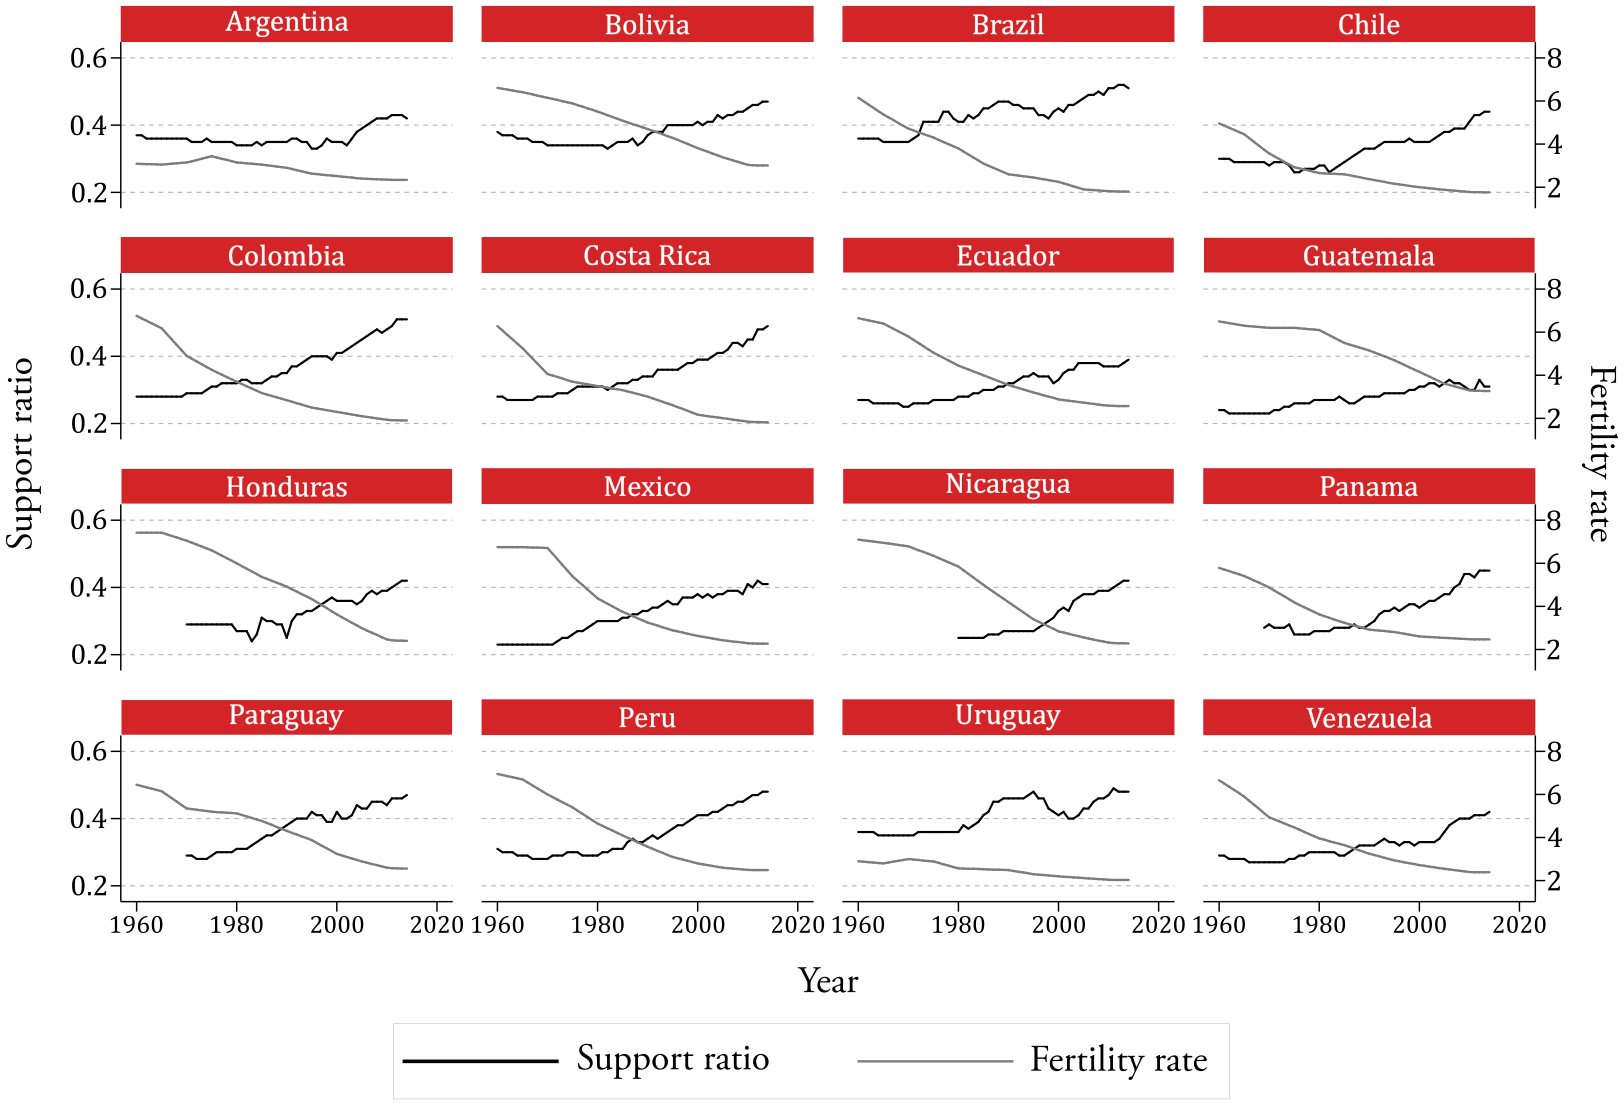
Source: own elaboration base on Population Division, United Nations
According to Lee et al. (2014), there is a steady-state fertility rate that maximizes support ratio for each country. In general, it is possible to find a one-for-one correspondence between long run fertility and long run support ratio. However, it is also possible to have a long run equilibrium fertility-support ratio that is too low for sustained GDP per capita growth.
In this sense, there is a possibility that countries with high support ratio and low fertility rate may be trapped in a considerably low fertility equilibrium with too low support ratio for sustain economic growth in the long term. Households in these countries take the level of development as given and choose low fertility which eventually leads to a low-level support ratio. This long-run equilibrium support ratio, in turn, is not high enough to guarantee long-run economic growth but is high enough to keep fertility that low. This kind of trap can happen if the cost of child rearing is increasing with the level of development so that a high level of per capita income leads to a higher child rearing cost and low fertility due to a quality–quantity tradeoff.
In order to model the relationship between the level of development of a country and its global fertility decisions, we modify the basic quantity-quality model proposed by Galor (2011), where the optimal fertility is determined by household income and education cost. We assume a logarithmic utility function that has the following form:
Where b is
the number of children that households define, c is a basket composed by the rest of
consumption and
From
the first order conditions, we obtain the number of children, which states that
the total cost of child rearing measured as a fraction of income,
In Galor’s basic model the cost of child rearing is considered to be exogenously given. But, Ha and Lee (2016) consider this as a function of development level or GDP per capita and/or the average level of human capital of the society. This is because as the economy grows or develops the importance of human capital becomes larger for learning cutting-edge technologies and hence the cost of education for one child increases, which is consistent with the thesis raised by Nelson and Phelps (1966). Similarly, as existing members of the society become more educated on average, it will require more expenditure to finish education for one child. This means that the cost of education can be written as:
Where subscript -1 refers to a one-year lag considering the lag between decision making on fertility and the current outcome. Equation (7) gives us the following model:
Taking logarithms, equation (9) is transformed into the following specification:
The low and middle-income trap hypothesis related to fertility decisions is associated with the fact that the support ratio increases, decreases and stagnates as the overall fertility rate decreases. Consequently, GDP per capita, ceteris paribus, grows, decreases and stagnates. In this sense, the steady-state equilibrium depends on the parameters. But if cost of child rearing is too sensitive to the level of development, the equilibrium level is high enough to keepcost of education high and fertility low, but not high enough to maintain a sustained economic growth.
Specifically,
our assumption of a low and middle-income trap implies negatives values of
Results confirm the proposed hypothesis. In the first model, the fertility rate is negatively and significantly associated with the GDP per capita, while in the second model, the incorporation of the stock of human capital eliminates this correlation and it is completely absorbed by it. In effect, the fertility-human capital elasticity is greater than that related to the GDP per capita. These results suggest that, as the economies of the region grow and accumulate human capital, taking advantage of the demographic bonus or first dividend, the fertility rate decreases endogenously, which, in absence of the contribution of other production factors such as the stock of capital per worker or the total factor productivity, implies a future fall of the support ratio and a stagnation of the economic growth.4
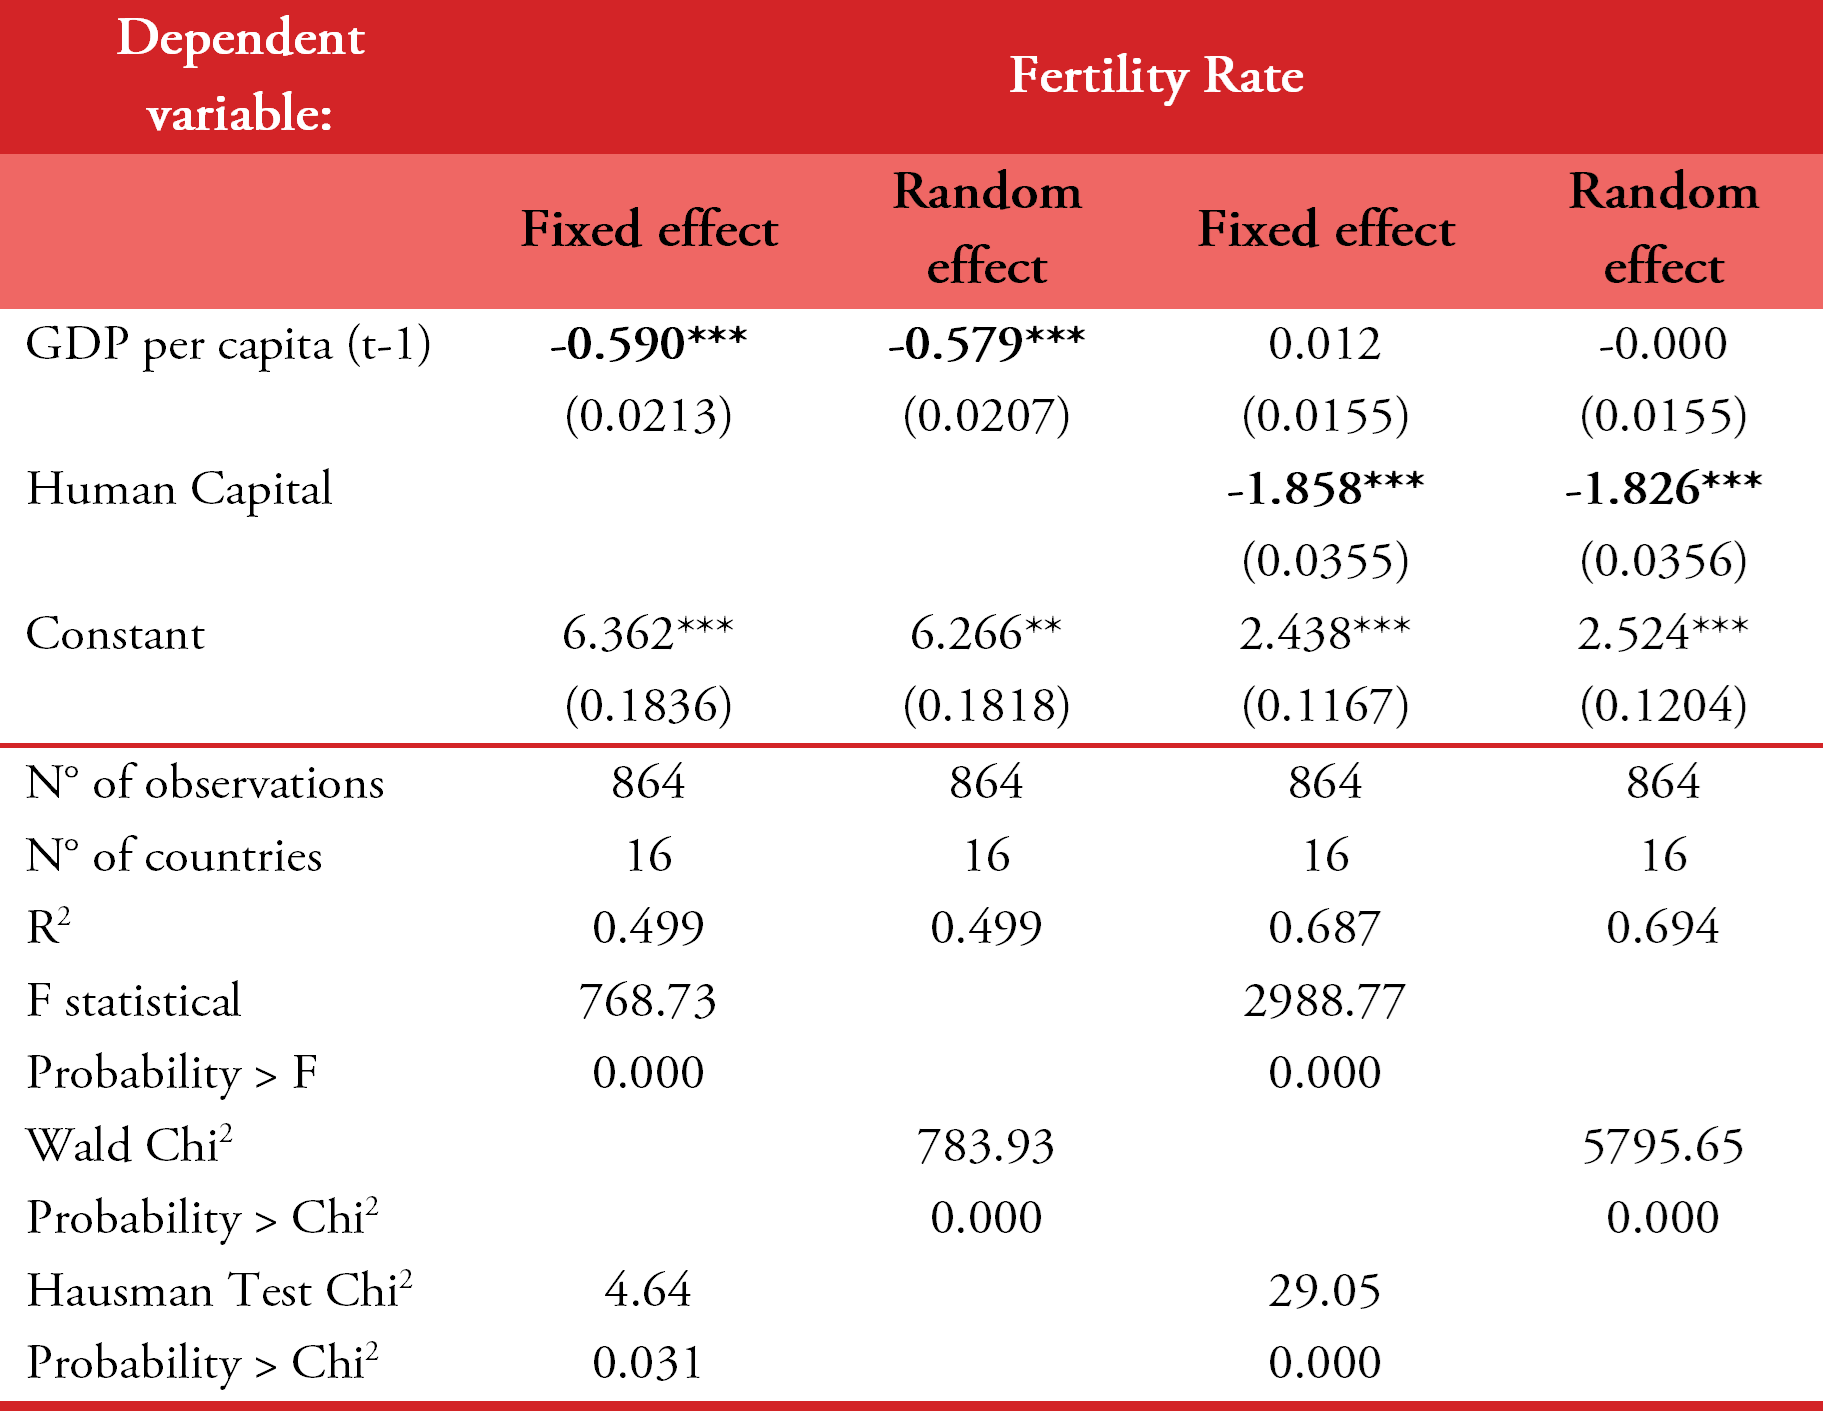
Source: own elaboration base on Penn World Table 9.0, Population Division, United Nations, and World Bank, World Development Indicator.Note: number in parenthesis are standard errors, *** significant level at 1%, ** at 5%, * at 10%.
V. Conclusion
Demographic changes have a significant relationship with the economic performance of Latin-American countries, and it can be a source of both opportunities and challenges in terms of economic growth. The stage of the demographic bonus is characterized as the most favorable for economic growth, but while countries reach the maximum of their support ratio, the aging stage can be a source of restrictions and even stagnation of growth.
As the global fertility rate decreases, support ratio increases, that is, the percentage of the active-age population in relation to the dependent population. It implies an increase in the relative size of the labor force and, therefore, in the growth of GDP per capita. However, while fertility continues its downward trend, together with an increase in life expectancy and in the older adult population, the support ratio starts decreasing. This phenomenon, ceteris paribus, could limit economic growth.
The dynamic between demographic changes and economic growth is partially endogenous. In effect, throughout this paper we have analyzed the middle/low income trap hypothesis in which Latin-American countries could be trapped in the medium and long term. On the one hand, the relationship between the fertility rate and the support ratio is clear. There is a first period in which a fall in the fertility rate implies an increase in the support ratio. Then, the fall or stabilization of the fertility rate implies a decrease in the support ratio, while the share of the elderly increases. On the other hand, greater support ratios imply higher rates of economic growth.
Therefore, lower fertility rates imply higher rates growth of GDP per capita through the support ratio. This relationship is also endogenous, since higher growth rate of GDP per capita requires more investment in human capital, which implies a reduction in the number of children that households decide to have. The fertility rate is significantly and negatively associated with the level of development and the stock of human capital achieved by countries.
As the economy grows or develops the importance of the accumulation of human capital increases due to the need to adapt and adopt new production technologies. This implies an increase in the cost of education and, therefore, a change in household decisions regarding the quantity-quality combination of children.
In absence of other sources of economic growth, especially the use of the demographic bonus to reach the second dividend, results found in this paper support the hypothesis that the low and middle-income trap equilibrium is present in some Latin America countries.
Savings rates of countries of the region are far from the levels observed in the Asian countries, since, in general terms, the region allocates a large part of the labor income to consumption, according to the age profile of the labor income and consumption relationship. The importance of this phenomenon lies in the need to achieve, in the medium and long term, increases in the stock of physical and human capital per worker, in order to increase productivity and lay the foundations for a sustained GDP per capita growth in the aging stage.
The period during the demographic bonus occurs is conducive to economic development since the aggregate life cycle surplus allows an increase in savings and, therefore, investment. The increase in the support ratio frees up resources for public and private investment in physical capital, allowing a rapid growth of the GDP per capita. This is the “first demographic dividend”. However, and as it has been analyzed in the present work, the contribution of the first dividend to the economic growth is transitory. During the aging stage the first dividend is reversed and operates by depressing growth. For this reason, the challenge from public policy is to generate an institutional framework and incentives that allow increases in the level of savings and channel it to investment, allowing the accumulation of physical and human capital and therefore an increase in productivity (second demographic dividend).
The second dividend would have permanent positive effects on growth that are associated with the prior period to aging. This mechanism operates basically through the increase in savings and the consequent accumulation of physical capital and external assets. By increasing the capital/worker ratio, productivity increases, and the national income improves. The question that naturally arises in this context is what factors operate on the added savings during the demographic bonus.
On the one hand, the first dividend generates a higher income, which can be directed to both consumption and investment in assets. Only in the case that at least part of the extra per capita income produced during the window of opportunity is saved and invested, the economy’s growth capacity will be enhanced, contributing to the materialization of the second dividend.
On the other hand, the second dividend can also be strengthened by the generation of extra savings related with the increasing weight that prime savers have during the window of opportunity. In this sense, it is expected that prime savers contribute significantly to the accumulation of capital as the demographic bonus occurs because the population that has completed or is close to completing their productive years increases and needs to save for retirement. Finally, as life expectancy increases, the number of years that one expects to live after retirement is increased, raising the set of resources necessary to finance consumption in the extra years of life.
These reasons to saving --which are inherent in any demographic transition --will, in turn, have more or less force depending on microeconomic and structural factors that affect incentives. Among the factors to be taken into account are: the tax burden on prime savers; family transfers to children and the elderly and the generosity of the pension system, which determines the percentage of retirement needs that are expected to be covered by current transfers instead of being based on assets accumulated during the active life. These elements have a particular influence on the amount of the accumulated wealth by the population over 50 years old that usually owns most of the assets of the economy.
Of course, this second dividend will emerge insofar as the institutional and policy frameworks induce individuals, companies and governments to increase the national savings rate and to direct it to finance the capital accumulation. In a context of low interest rates, underdeveloped financial markets, macroeconomic volatility and absence of investment alternatives, it is unlikely that people with life cycle can sustain the required investments to maintain capital accumulation and, therefore, the increase in productivity and economic growth.
In this context, public policy initiatives that are implemented during the window of opportunity play an important role. Both the first and second dividends are tributary of the demographic bonus and it is important to generate conditions that encourage savings by economic agents, particularly those who are in the life cycle surplus stage.
References
Albrieu, R and Fanelli, J. M. (2013). On the macroeconomic and financial implications of the demographic transition, presented in IX Meeting of the Working Group on Macroeconomic Aspects of Intergenerational Transfers, Faculty of Economics, University of Barcelona, June 3-8, 2013.
Apella, I., Packard, T., Joubert, C. and Zumaeta, M. (2019). Retos y Oportunidades del Envejecimiento en Chile. Santiago, Chile: World Bank. Available at: http://documentos.bancomundial.org/curated/es/591471558704698806/Retos-y-Oportunidades-del-Envejecimiento-en-Chile
Aravena, C., Escobar, L. and Hofrman, A. (2015). Fuentes del crecimiento económico para América Latina y el Caribe, 1990-2013. Economic Commission for Latin America and the Caribbean, Serie Macroeconomía del Desarrollo 164.
Aravena, C. and Hofman, A. (2014). Crecimiento económico y productividad en América Latina. Una perspectiva por industrias-base de datos LA KLEMS. Economic Commission for Latin America and the Caribbean, Serie Macroeconomía del Desarrollo 152.
Becker, G. (1960). An Economic Analysis of Fertility. In Becker, G. S. (ed.), Demographic and Economic Change in Developed Countries, Princeton University Press.
Caselli, F. (2004). Accounting for cross-country income differences. NBER working paper 10828
Fanelli, J. (2015). Demography and macroeconomic. Opportunities and risks in dividend-era Argentina. In Gragnolati, M., Rofman, R., Apella, I. and Troiano, S., 2015. As time goes by in Argentina. Economic opportunities and challenges of the demographic transition. Direction in Development. World Bank, Washington, D. C.
Feenstra, R., Inklaar, R. and Timmer, M. (2015). The next generation of the Penn World Table. American Economic Review, 105(10), 3150-82.
Galor, O. (2011). Unified growth theory. Princeton University Press.
Ha, J. and Lee, S. H. (2016). Demographic dividend and Asia’s economic convergence towards the US. The Journal of the Economics of Ageing, 8(2016), 28–41.
Lee, R., Mason, A. and Miller, T. (2003). From transfers to individual responsibility: implications for savings and capital accumulation in Taiwan and the United States. Scandinavian Journal of Economics, 105(3), 339-57.
Loayza, N. (2008). El crecimiento económico en Perú. Economía, 31(61), 9-25.
Mason, A. and Lee, R. (2006). Back to basics: what is the demographic dividend. Finance & Development (Washington, D.C.: International Monetary Fund), 16-17.
Mason, A. and Lee, R. (2007). Transfers, capital, and consumption over the demographic transition. In R., Clark, N., Ogawa and A. Mason (Eds.) Population aging, Intergenerational transfers and the Macroeconomy. Cheltenham, UK: Edward Elgar 128-162.
Mason, A. and Lee,R. (2011). Population aging and the generational economy: a global perspective. Cheltenham, UK, Edward Elgar.
Nelson, R. and Phelps, E. (1966). Investment in humans, technological diffusion, and economic growth. American Economic Review, 56(2), 69–75.
Rofman, R. and Apella, I. (2020). When We’re Sixty-Four: Opportunities and Challenges for Public Policies in aPopulation-Aging Context in Latin America. International Development in Focus. Washington, DC: World Bank. doi: https://doi.org/10.1596/978-1-4648-1605-5.
Young, A. (1995). The tyranny of numbers: confronting the statistical realities of the East Asian growth experience. The Quarterly Journal of Economics, 110(3), 641-680
Appendix
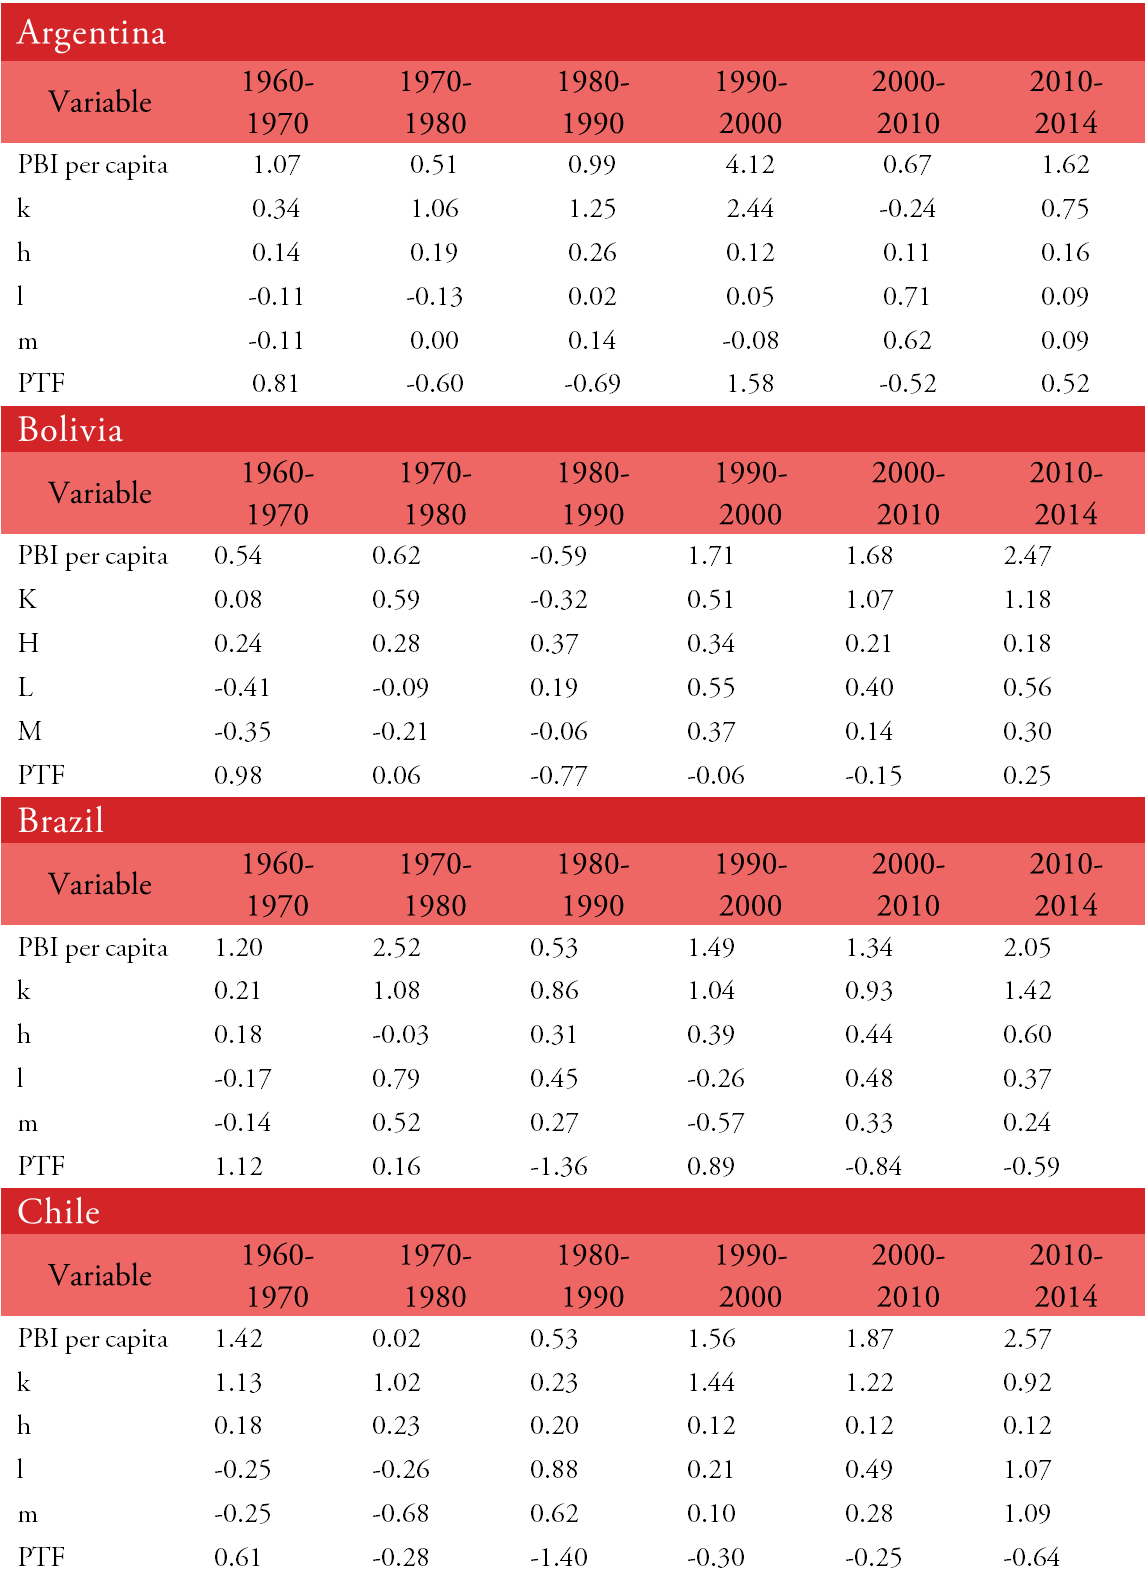
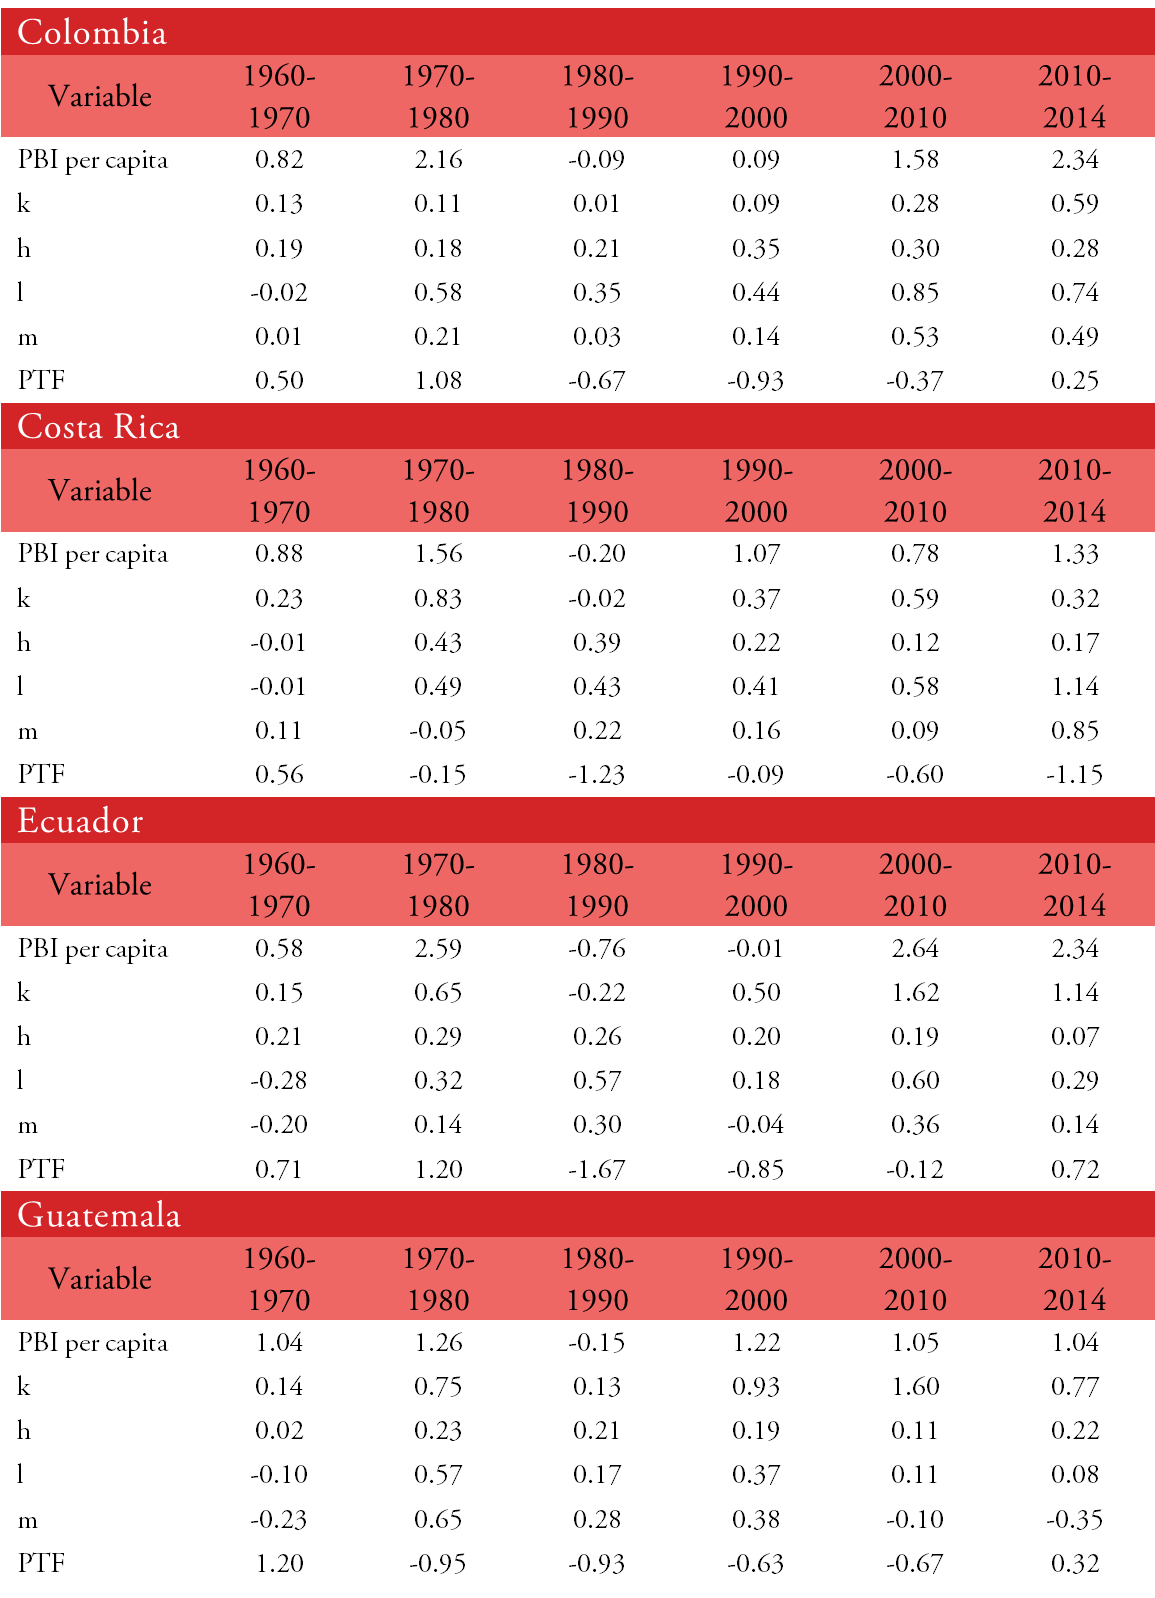
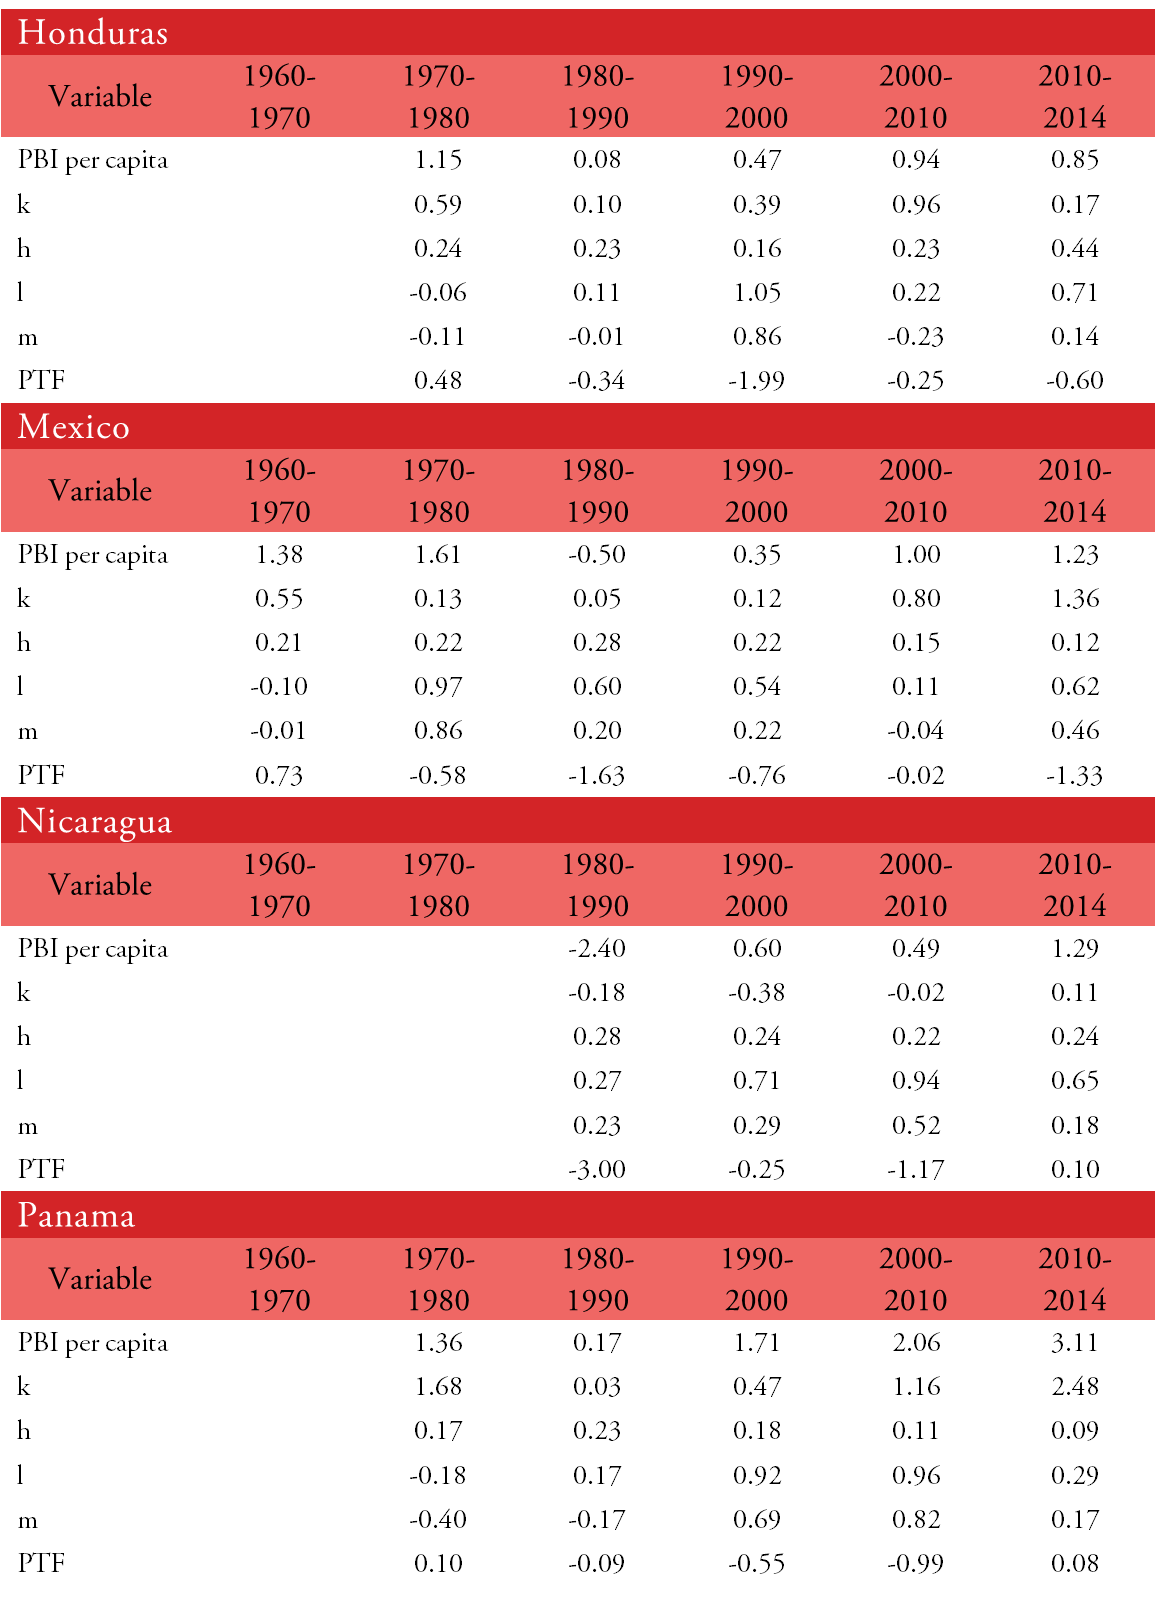
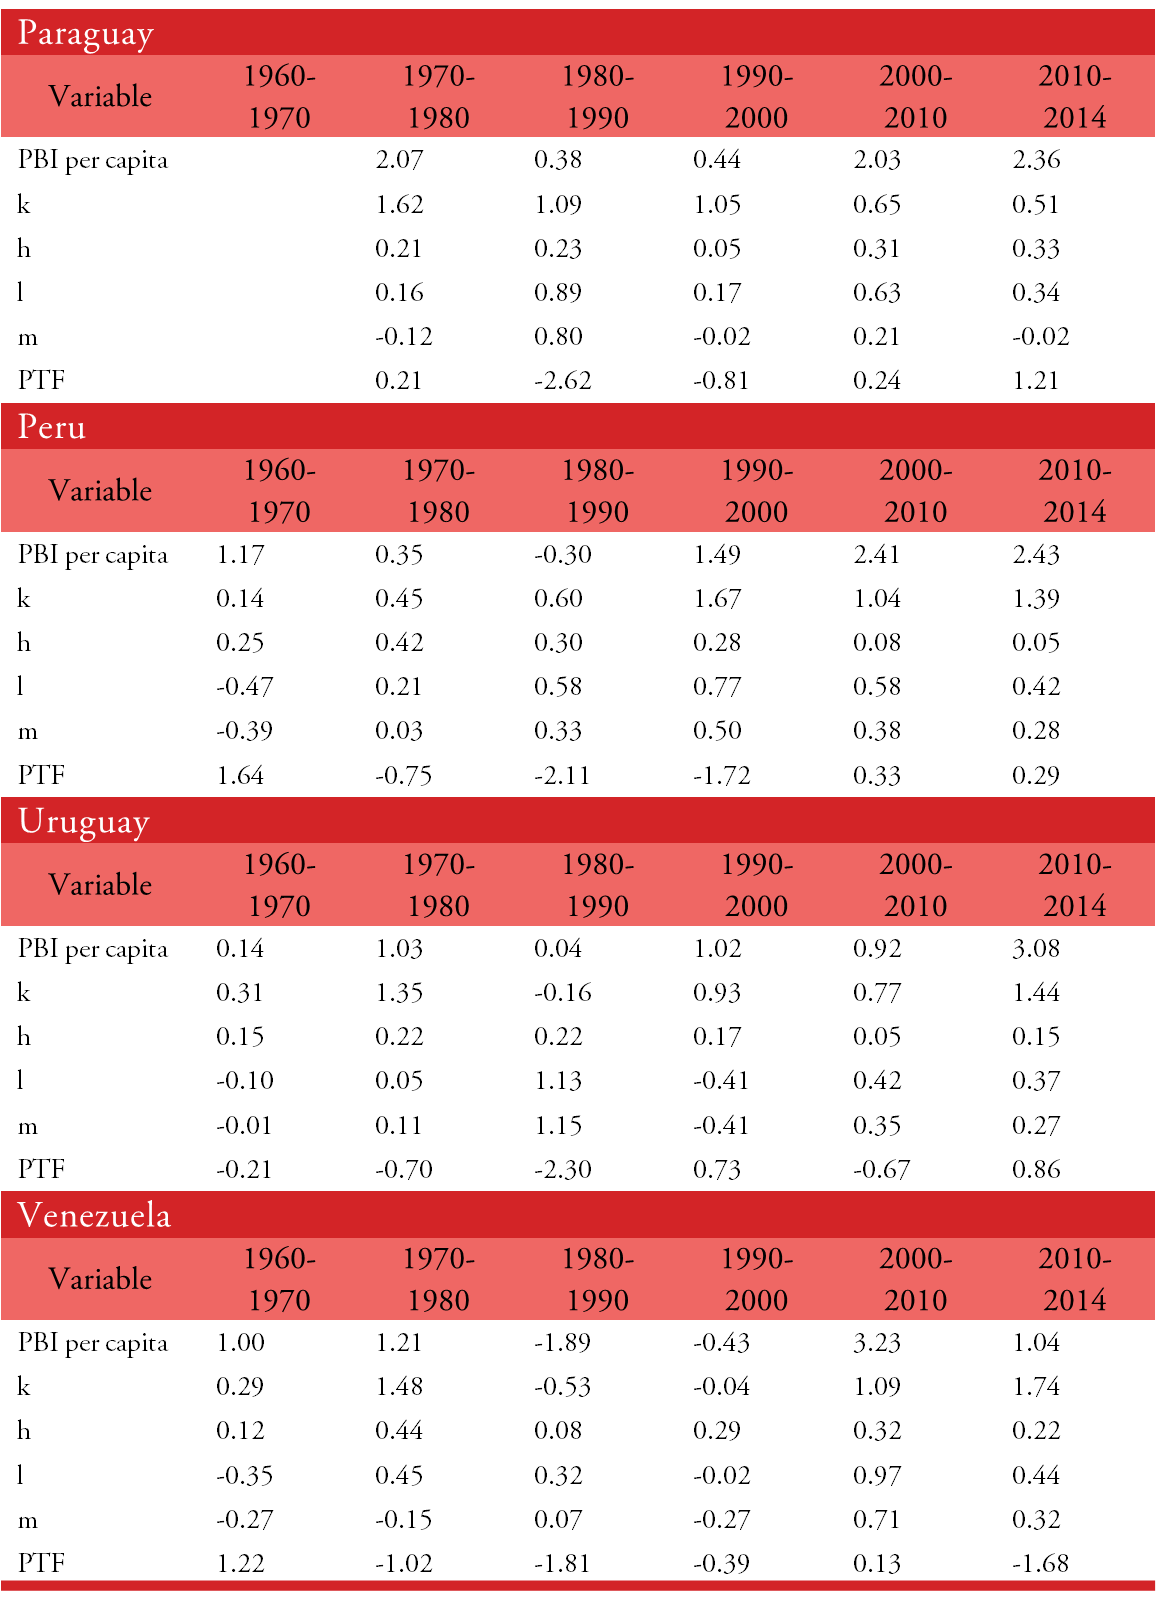
Source: own elaboration base on Penn World Table 9.0, Population Division, United Nations, and World Bank, World Development Indicator
Notes

