Selection of dairy goats using milk recording and multivariate analysis in a family farming system
Revista de la Facultad de Agronomía
Universidad Nacional de La Plata, Argentina
ISSN: 1669-9513
Periodicity: Frecuencia continua
vol. 122, 124, 2023
Received: 18 July 2022
Accepted: 17 November 2022
Abstract: Although dairy control is a widely used tool in herds with numerous animals (mainly cows), it is often neglected in small farms. The aim of the present work was to select the most suitable animals for milk production using dairy control and multivariate statistics. Results indicate a great dispersion of the data as a consequence of milk production variation from each goat. These results demonstrate the need to identify and select the most productive animals in order to have a selected and controlled flock. The analysis of hierarchical conglomerates showed that the herd can be divided into three groups: Cluster 1 is integrated by 31 goats with the highest productive parameters, above the herd average and together produce 59.1% of the accumulative milk yield; Cluster 2 consists of 24 animals whose production parameters are close to the current average of the herd and accumulates 27.7% of milk production and Cluster 3 groups animals with the lowest production. From the results obtained, it was possible to make the selection of the 55 most productive animals for milk production. This represents 64.70% of the herd and they are responsible for 86.8% of the total milk production.
Keywords: lactation curve, Principal Components Analysis (PCA), Hierarchical Conglomerates, dairy control, milk production.
Resumen: Si bien el control lechero es una herramienta ampliamente utilizada en rebaños con gran cantidad de animales (principalmente vacas), no se utiliza en pequeñas explotaciones como las que pertenecen a la agricultura familiar. El objetivo del presente trabajo fue seleccionar los animales más aptos para la producción de leche de cabra en un sistema de la agricultura familiar, utilizando control lechero y estadística multivariada. Los resultados indican una gran dispersión de los datos como consecuencia de la variación de la producción de leche de cada cabra; estos resultados demuestran la necesidad de identificar y seleccionar los animales más productivos para tener un rebaño controlado. El análisis de conglomerados jerárquicos mostró que el rebaño se puede dividir en tres grupos: el conglomerado 1 está integrado por 31 cabras con los parámetros productivos más altos, por encima del promedio del rebaño y en conjunto producen el 59,1% de la producción de leche acumulada; el Clúster 2 está formado por 24 animales cuyos parámetros productivos se acercan a la media actual del rebaño y acumula el 27,7% de la producción de leche y el Clúster 3 agrupa a los animales de menor producción. A partir de los resultados obtenidos se pudo realizar la selección de los 55 animales más productivos para la producción de leche. Esto representa el 64,70% del hato y son responsables del 86,8% de la producción total de leche.
Palabras clave: curva de lactación, Análisis de Componentes Principales (ACP), conglomerados jerárquicos, control lechero, producción de leche.
INTRODUCTION
Although dairy control is a widely used tool in herds with numerous animals (mainly cows), it is often neglected in small farms. Lactation curve can be defined as a biological process explained by a mathematical equation. It is useful for forecasting total production, for planning herd management using a reliable prediction tool, and for selecting animals considering the relationships among the different parts of the curve (Espinosa et al., 2016; Vinay-Vadillo et al., 2012).
The ideal lactation profile is a curve with a high peak and a moderate decrease afterwards. Peak yield, being the moment that determines the lactation curve to the greatest extent, varies among species and animals. It is known that in dairy goats it is essential to know the dairy production and the factors that modify it (Peña Blanco et al., 1999). Among the many factors influencing the quantity and quality of goat milk are: race, individual, stage of lactation, feeding, type of milking, type of calving, number of lactation and herd management (Idowu & Adewumi, 2017).
Goats have a unique role in smallholder agriculture as they require small investments; they have broad feeding habits, short reproductive cycle, and good adaptation to unfavorable environmental conditions and suit the circumstances of especially resource poor livestock keepers (Seid & Kebede, 2015).
Dairy goat systems in Santiago del Estero belong to family farming and are characterized by small farms, low technological level and insufficient investment. The goat milk sector is mostly comprised of farms and microenterprises where family labor prevails (Paz et al., 2003; Pece et al., 2017). The predominant milk production system is semi-extensive; food is mainly based on open field grazing, using natural forages as the basis of food. These systems are limited by the instability and seasonality of their productions, as well as by poor and inadequate marketing in most cases (Pece et al., 2017).
Even though lactation curves have been carried out in Santiago del Estero (Paz et al., 2005; Paz et al., 2007), this methodology has not been used for the selection of animals or management of the herd.
The aim of the present work was to select the most suitable animals for milk production using multivariate statistics in a family farming system.
MATERIALS AND METHODS
The study was conducted in a goat farm, located in El Polear, La Banda, Santiago del Estero, Argentina. The farm belongs to the family farming system and there is no control of production, especially in aspects such as feeding, replacement or control of cattle. The milking herd is composed by 81 Anglo Nubian (AN) x Criolla (C) and Saanen (S) x Criolla crossbred goats. Animals graze in areas with no division. Goats, during milking, have a supplement consisting of 390 g of alfalfa (Medicago sativa) and 265 g of maize (Zea maiz) per animal.
The experiment was carried out from July 2018 to July 2019; milk recording was performed by three supervisors according to the recommendations for A4 (ICAR, 2003). The milk obtained from each animal was weighed; then, a sample was obtained and kept refrigerated until their analysis at the National University of Santiago del Estero, distant 10 km from the farm.
A total of 421 lactations were used from 85 healthy goats. The first control was carried out between days 10 and 20 after birth, with lactation being considered terminated when milked milk was below 200 g/d. Milk production (typified at 210 days and complete lactation) was estimated by the Carré adaptation to the method of Fleischmann, since it is the ideal in the conditions of this experience (Vega et al., 1999).
Milk fat and protein content was determined by triplicated using LactoStar Funke Gerber 3560 automatic analyzer. The results were expressed as % w/v.
All data gathered during the study period were coded and recorded in Microsoft Excel 2007. The data obtained in the dairy control were used to analyze the variability and similarity of the following productivity indicators: actual production, standardized production at 210 days, duration of lactation, fat, and protein content. For the study, multivariate analysis techniques, Principal Components Analysis (PCA) and Hierarchical Conglomerates were used (Arredondo et al., 2015; Camelo et al., 2008; Yakubu et al., 2011). The statistical system InfoStat version 2018 was used for the information processing.
RESULTS
Table 1 shows general statistics of the parameters obtained from controlled lactations and Table 2 presents production parameters by calving season. Figure 1 shows the individual milk production during the 421 controlled lactations.
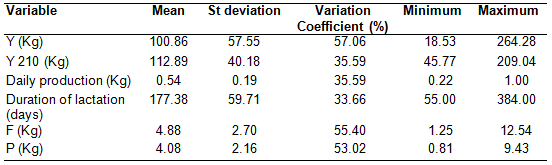
General statistics of milk production parameters. References: Y: accumulated milk yield; Y 210: normalized yield to 210 days; F: accumulated fat production; P: accumulated protein production.
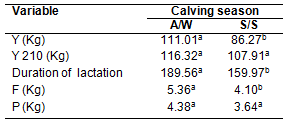
Mean values by calving season. Different superscripts in the rows mean that there are significant differences between the calving season. References: Y: accumulated milk yield; Y 210: normalized yield to 210 days, F: accumulated fat production; P: accumulated protein production.
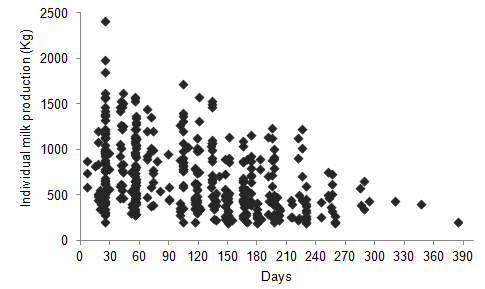
FIGURE 1
Dispersion of individual milk production during lactation.
Figure 2 presents the analysis of hierarchical conglomerates showed that according to Y, F, and Y210, the herd can be divided into three groups. Table 3 shows the characteristics of the selected animals in each cluster.
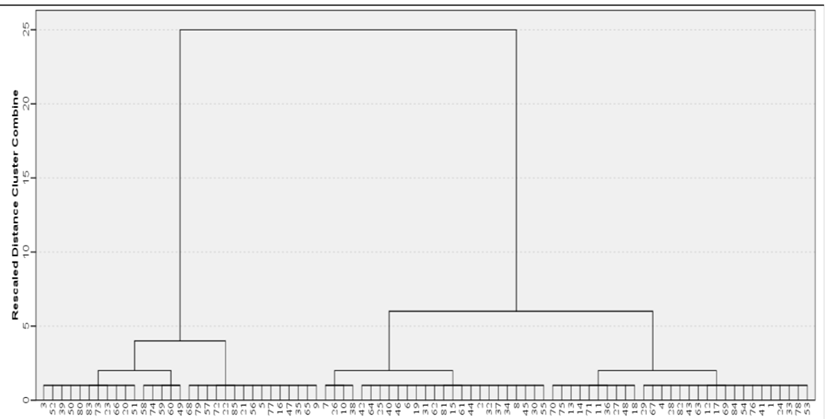
FIGURE 2
Dendogram showing the similarity relationships between the 85 animals under study.
DISCUSSION
Table 1 shows the results of the parameters obtained from controlled lactations. The accumulated milk yield (Y) has a very high coefficient of variation, which coincides with other studies carried out in the region in establishments with similar breeding characteristics (Funes & Mótola, 1998; Paz et al., 2007); these results were expected due to heterogeneity in feeding, structure and lack of control of the herd. More controlled productions present less variations (Garcés et al., 2004; Peña Blanco et al., 1999).
Both parameters Y and normalized yield to 210 days (Y210) is lower than reported by other authors, even in the same region and much lower than reported in other regions (Funes & Mótola, 1998; Garcés, et al., 2004; Paz et al., 2005; Peña Blanco et al., 1999). Body condition (BC) of animals was one of the main factors that influenced milk production; the relationship between milk yield and body measurements suggests that the goats with better body weight and size generally produce more milk (Waheed & Khan, 2011). In this work, BC indices ranged from 1 (low weight animals and body measurements below the expected) to 3 (animals of adequate weight and normal body measurements for the breed). In the present study low-weight animals with poor body condition predominate in the flock; this fact would explain, in part, the low production. Another factor that directly affects the low milk production is the feeding of the animals, since the animals are fed according to the natural fodder offer. These factors cause that the nutritional requirements of the animals are not covered in the different physiological stages of the herd.
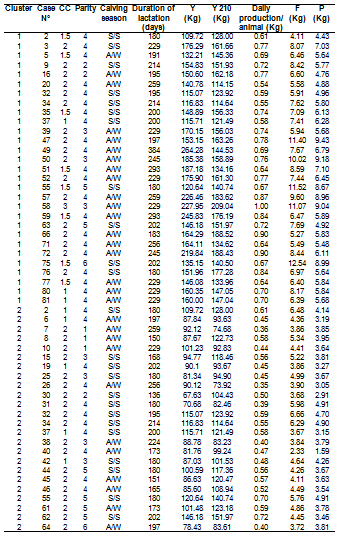
Characteristics of the animals selected by multivariate analysis.
Lactation has an average duration of 177.4 days, which coincides with the report of other authors in the region (Funes & Mótola 1998; Paz et al. 2005). The analysis of the variance was carried out in order to define the incidence of body condition, parity (first, second, third or greater) and calving season –autumn/winter (A/W) or spring/summer (S/S)- in the productive factors. Y, fat, accumulated production and duration of lactating have significantly higher values (p<0.05) in A/W-calving; no significant differences were observed in body condition or parity (Table 2). Increased Y is mainly associated with A/W births, when the days begin to lengthen and there are more hours of light, which causes an inhibition in animals and affects milk production (Hernández Ferrer, 1991). Was observed that Y was higher in A/W than in S/S (+24.74 Kg); while the average duration of lactation was 29.59 days longer in A/W than in the S/S season (Table 2). Often small producers prefer to concentrate calvings in the spring-summer season. These results indicate that "winter milk" would increase the production of the herd.
The differences found in fat content are the result of herd feeding since the pastures are also influenced by the season of year (Ferland et al., 2018). Fat content in milk fluctuates according the calving season, with higher levels being reported during the fall and the lowest at the beginning of the summer (Salvador & Martínez, 2007).
Figure 1 shows the individual milk production during the 421 controlled lactations. The points estimate a curve with an ascending phase, which has a peak at 30 days postpartum and a descending phase that begins at 120 days after delivery. Data dispersion is the result of the variation in milk production. These results demonstrate the need to identify and select the most productive animals in order to have a selected and controlled flock. Selection of animals would allow resources to be assigned to fewer animals that enable for greater milk production.
The Kaiser-Meyer-Olkin test (0.822) and Bartlett's test of sphericity (Chi-square = 1573.928, P <0.00) determined the validity and confidence of the data to perform the factor analysis. PCA yielded 5 components that explained 100% of the total variance observed, of which the first two explained 98.40%.
In the first component, which explained 77.51% of the variance, Y and F were the variables of greatest relevance, while the second component, which explained 20.89% of the variance, had Y210 as a relevant variable.
Taking a distance of 5, the analysis of hierarchical conglomerates showed that according to Y, F, and Y210, the herd can be divided into three groups (Figure 2) (Arredondo et al., 2015).
Cluster 1 was integrated by 31 goats with the highest productive parameters, above the herd average, together producing 59.1% of the accumulated milk yield. Cluster 2 was integrated by 24 animals whose production parameters were close to the current average of the herd and accumulates 27.7% of milk production. Cluster 3 included the animals with the lowest production, below the current mean values. Based on these results, animals of group 1 and 2 are selected to continue the productive activity. The goats of cluster 3 were discarded from the milking but they were destined to feed the newborns.
CONCLUSION
The results indicate the effectiveness of the use of multivariate statistics in the selection of animals from a herd in the family farming system. The use of this method will allow, quickly and economically, select the animals that satisfy the needs of the producer. From the results obtained, it was possible to make the selection of the 55 most productive animals for milk production. This represents 64.70% of the herd and they are responsible for 86.8% of the total milk production. Selection of the most productive animals will allow the small producer to better allocate resources and thus increase production.
REFERENCES
Arredondo, V., Macedo, R., Molina, J., Magaña, JC., Prado, O. y García, L. (2015). Análisis multivariado de la variación morfológica de la oveja Pelibuey en Colima, México. Actas Iberoamericanas de Conservación Animal, 5, 87–92.
Camelo, S., Torres, V., & Díaz, M. F. (2008). Análisis multivariado de los factores antinutricionales de los granos de leguminosas temporales. Revista Cubana de Ciencia Agrícola, 42(4), 336–339.
Espinosa, A. P., Fundora, D. G. P., Iglesias, D. G., Villavicencio, J. L. E., Pérez, R. O., Trujillo, A. G., y Serrano, N. Á. (2016). Curvas de lactancia individuales en vacas Siboney de Cuba. Revista Mexicana De Ciencias Pecuarias, 7(1), 15–28. https://doi.org/10.22319/RMCPV%4147
Ferland, M.C., Guesthier, M.A., Cue, R.I., Lacroix, R., Burgos, S.A., Lefebvre, D. y Wade, K.M. (2018). Effect of feeding system and grain source on lactation characteristics and milk components in dairy cattle. Journal of Dairy Science, 101(9):8572-8585. https://doi.org/10.3168/jds.2017-13787
Funes, Á., y Mótola, R. R. P. (1998). Tipificación de la producción lechera de caprinos. Archivos de Zootecnia, 47: 649-658.
Garcés, R., Boza, J., Acevedo, P., Brandl, E. y Bruckmaier R.M. (2004). Persistence index and description of first 100 days of the lactation curve of primiparous and multiparous Saanen goats maintained in confinement. Agricultura Técnica, 64(3), 319–326.
Hernández Ferrer, D. (1991). Bases de un Programa de Selección de Ganado Caprino: Controles de Producción. Tesis Doctoral. Facultad de Ciencias. Universidad de Córdoba. España.
Idowu, S. y Adewumi, O. (2017). Genetic and Non-Genetic Factors Affecting Yield and Milk Composition in Goats. Advances in Dairy Research. 5(2). http://dx.doi.org/10.4172/2329-888X.1000175
International Committee for Animal Recording (ICAR) (2003). Guidelines approved by the General Assembly held in Interlaken, Switzerland.
Paz, R. G., Togo, J. A. y López, C. (2007). Evaluación de parámetros de producción de leche en caprinos (Santiago del Estero, Argentina). Revista Cientifica de La Facultad de Ciencias Veterinarias de La Universidad Del Zulia, 17(2), 161–165.
Paz, R. G., Togo, J. A., Usandivaras, P., Castel, J. M., y Mena, Y. (2005). Análisis de la diversidad en los sistemas lecheros caprinos y evaluación de los parámetros productivos en la principal cuenca lechera de Argentina. Livestock Research for Rural Development, 17(1).
Paz, R., Lipshitz, H., Álvarez, R. y Usandivaras, P. (2003). Diversidad y Análisis económico en los sistemas de producción lecheros caprinos en el área de riego del Río Dulce-Santiago del Estero-Argentina. ITEA. Producción Animal, 99A(1), 10–40.
Pece, N., Frau, F. y Valdez, G. F. De. (2017). Cuenca lechera caprina de Santiago del Estero: producción primaria e industrial. Desarrollo de nuevos productos lácteos. En A. Albanesi (Ed.) Aportes de la FAyA (UNSE) para el desarrollo agropecuario y agroindustrial del NOA (pp. 75–90) Universidad Nacional de Santiago del Estero.
Peña Blanco, F., Vega Vilca, J., Sánchez Rodríguez, M., Martos Peinado, J., García Martínez, A. y Domenech García, V. (1999). Producción láctea y ajuste de la curva de lactación en caprinos de raza Florida. Archivos de Zootecnia, 48(184), 415–424.
Salvador, A. y Martínez, G. (2007). Factores que afectan la producción y composición de la leche de cabra: Revista de la Facultad de Ciencias Veterinarias, 48(2):61-76.
Seid, A. y Kebede, K. (2015). Breeding Objective, Selection Criteria and Breeding Practice of Indigenous Goats in Western Ethiopia : Implications for Sustainable Genetic Improvement. Greener Journal of Agricultural Sciences, 5(5), 167–176. http://dx.doi.org/10.15580/GJAS.2015.5.072715105
Vega, J., Peña, F., Sánchez, M., y Florida, R. (1999). Estimación de la producción de leche por el método Fleischmann en caprinos. Archivos de Zootecnia, 48, 347–350.
Vinay-Vadillo, J. C., Villagómez-Cortés, J. A., Acosta-Rodríguez, M. R. y Rocher, C. (2012). Shapes of Lactation Curves of F1 (Holstein X Zebu) Cows in the Humid Tropic of Veracruz, México. International Journal of Animal and Veterinary Advances, 4(6), 370–377.
Waheed, A. y Khan M.S. (2011). Genetic Parameters of Body Measurements and their Association with Milk Production in Beetal Goats. Advances in Agricultural Biotechnology, 1, 34–42.
Yakubu, A., Salako, E. E. y Abdullah, A.R. (2011). Varimax rotated principal component factor analysis of the zoometrical traits of Uda sheep. Archivos de Zootecnia, 60(231), 813–816.

