

Above-ground net primary productivity and rain use efficiency of Chaco Semi-arid Forest in Copo National Park, Santiago del Estero, Argentina
Productividad primaria neta aérea y eficiencia en el uso de la lluvia del Bosque Semiárido Chaqueño en el Parque Nacional Copo, Santiago del Estero, Argentina
Revista de la Facultad de Agronomía
Universidad Nacional de La Plata, Argentina
ISSN: 1669-9513
Periodicity: Frecuencia continua
vol. 122, e120, 2023
Received: 26 November 2021
Accepted: 17 November 2022
Corresponding author: tiedemannjl@gmail.com
Abstract:
According to the REDD + Program, it is necessary to monitor, quantify and report the forest system status of protected areas. Having this in mind the objective of this work is to delimit the growing seasons of Chaco Semi-arid Forest (FCHS) in Copo National Park (CNP), Santiago del Estero, Argentina, in the 2000-2022 period using time series of NDVIMODIS., and to quantify their Seasonally Integrated Aboveground Net Primary Productivity (SI-ANPP), its trend, and Rain Use Efficiency (RUE), and relate them to integrated seasonal rainfall (SR). The NDVIMODIS time series and the 0.5 NDVIRATIO thresholds made it possible to delimit the growth season, and quantify the SI-ANPP of FCHS with high efficiency. Significant differences were found (T = -3.49; p = 0.0006) in the SI-ANPP of FCHS. The SI-ANPP evidences high sensitivity to negative anomalies of seasonal rainfalls. The nonlinear regression model obtained (R2 = 0.73; p < 0.0001) provides unedited information at the local level on the efficiency of the SI-ANPP in terms of the SR. Seasonal rainfall >700 mm could be considered a threshold (or boundary) in the efficient water use of FCHS. The large positive trend of SI-ANPP of the FCHS CNP in the period 2000-2022 (slope = 462.43; T = 25.64; p <0.0001) evidenced the high stability of the forest system. The results obtained reaffirm the importance of creating legally protected areas, such as national parks, for the preservation of forest systems in the region.
Keywords: Thresholds, Seasonal rainfall, Biomass, NDVI time series.
Resumen:
De acuerdo al programa REDD+, es necesario monitorear, cuantificar, e informar el estado de los bosques de las áreas protegidas. Con base a lo antes expuesto los objetivos de este estudio fueron, delimitar la estacionalidad del bosque Chaqueño Semiárido del Parque Nacional Copo, Santiago del Estero, Argentina (FCHS CNP) en el periodo 2000-2022 mediante series temporales NDVIMODIS. Cuantificar la Productividad Primaria Neta Aérea estacional integrada (SI-ANPP), su tendencia, y el uso eficiente del agua (RUE) y relacionarlo con las precipitaciones estacionales integradas (SR). Las series temporales NDVIMODIS y el umbral 0.5 NDVIRATIO posibilitaron delimitar la estación de crecimiento y cuantificar la SI-ANPP con elevada eficiencia. Fueron encontradas diferencias significativas (T = -3.49; p = 0.0006) en la SI-ANPP del FCHS CNP. La SI-ANPP evidencia sensibilidad a las anomalías negativas de precipitaciones estacionales. El modelo no lineal obtenido (R2 = 0.73; p < 0.0001) provee inédita información a nivel local sobre la eficiencia de la SI-ANPP del FCHS en función de las SR. La precipitación estacional >700 mm podría ser considerada umbral (o límite) en el uso eficiente del agua del FCHS. La elevada tendencia positiva de la SI-ANPP del FCHS CNP en el periodo 2000-2022 (slope = 462.43; T = 25.64; p <0.0001), evidencia una elevada estabilidad del sistema forestal. Los resultados obtenidos reafirman la importancia de la creación de áreas legalmente protegidas, como parques nacionales para la preservación de los sistemas forestales de la región.
Palabras clave: Umbrales, Precipitaciones estacionales, Biomasa, Series temporales de NDVI.
INTRODUCTION
The United Nations Framework Convention on Climate Change has adopted mechanisms for reducing emissions, and has contributed to the role of conservation, forest sustainable management and enhancement of forest carbon stocks in developing countries (REDD+) (Kumar & Mutanga, 2017). In this regard and in accordance with FAO (2020) the creation of protected areas provided positive results in establishing barriers to the increase of emissions, thus favoring biodiversity conservation.
According to FAO (2020) 18% of the Earth land area is currently protected, being most forests in legally protected areas, 31% are located in South America, among which is Copo National Park (CNP) in Santiago del Estero, Argentina. Copo National Park, created by Law No. 25,366, has a vital role in preserving the ecological services of Chaco Semi-arid Forest (FCHS) that integrates it. Consequently, and in agreement with the REDD+ Programme, it is necessary to locate, measure, monitor and report, in the long term and with appropriate technologies, the Above-ground biomass of forest cover (Kumar & Mutanga, 2017). Forest aboveground biomass plays an important role in the study of the carbon cycle and climate change in the global terrestrial ecosystem (Reichstein et al. 2007, Kumar & Mutanga, 2017, Reichstein & Carvalhais, 2019).
Forest aboveground biomass estimation based on remote sensing is an effective method in regional scale studies (Gavinet et al., 2019; Li et al., 2020). A widely-used indicator for deriving vegetation productivity from remotely sensed imagery is the Normalized Difference Vegetation Index (NDVI) (Rouse et al., 1973). The significant relationships existing between the NDVI and the fraction of the photosynthetically active radiation absorbed make it possible to determine the aboveground net primary productivity (ANPP) from data derived from NDVI time series (Kumar & Mutanga, 2017; Zhang et al., 2018; Baldassini, 2018; Li et al., 2020; Baldassini & Paruelo, 2020; Gao et al., 2020). NDVI time series have been used to derive phenology metrics from land surface data in a great number of studies (Zhang et al., 2018, Li et al., 2020). The ANPP is the temporal integration of the positive increase of the biomass of vegetation photosynthetically active, and it is one of the most integrative descriptors of ecosystem functioning (Kumar & Mutanga, 2017; Zhang et al., 2018; Baldassini, 2018; Gavinet et al., 2019; Li et al., 2020; Baldassini & Paruelo, 2020; Gao et al., 2020). It was created from the Monteith’s empirical model (1972), based upon radiation use efficiency which is a useful tool to quantify seasonal biomass production without limitations of water, temperature and fertility.
Photosynthetically active vegetation delimits the growing season (Kumar & Mutanga, 2017; Li et al., 2020) and is closely linked to the amount and distribution of seasonal precipitation (Le Houérou et al., 1988, Robinson et al., 2013; Dardel et al., 2014; Zhang et al., 2014; Zhang et al., 2018; Zhang et al., 2020; Li et al., 2020) and to the moisture available in soil (Noy-Meir, 1973), particularly in arid and semi-arid zones (Le Houérou et al., 1988). Aboveground net primary productivity a key integrative measure of ecosystem functioning, increases across ecosystem types with increasing mean annual precipitation (Le Houérou et al., 1988, Sala et al., 1988).
Rain Use Efficiency (RUE), defined as the ratio between ANPP and rainfall, is increasingly used to diagnose land degradation (Huxman et al., 2004; Dardel et al., 2014; Gamoun, 2016). It has also been increasingly used to analyze vegetation production variability in arid and semi-arid biomes where rainfall is a major limiting factor for plant growth (Noy-Meir, 1973; Huxman et al., 2004; Newman et al., 2006; Bai et al., 2008; Vermeire et al., 2009). RUE is a useful ecological parameter to determine ecosystem adaptation to climate change and characterizes the efficiency of converting CO. into dry biomass by using water (Le Houérou, 1984). The amount of biologically available water is determined by the spatial and temporal distribution and quantity, timing and frequency of rainfall events (Newman et al., 2006). A discussion of the role of the soil in arid ecosystems is inseparable from a discussion of the ecosystem water balance and its dynamics. The soil acts as a temporary store for the precipitation input, allowing its use by organisms. A regulator controlling the partition of this input between the major outflows: runoff, drainage, evaporation, and uptake transpiration, the latter (biologically active) flow between different organisms (Noy-Meir, 1973). It has been demonstrated that ANPP which integrates numerous ecological processes and ecosystem characteristics, is constrained by water availability (Hsu et al., 2012, Li et al., 2020).
Based on the above, the objectives of this work are to delimit the growing seasons of the Chaco Semi-arid Forest in Copo National Park, Santiago del Estero, Argentina, in the 2000-2022 period using time series of NDVIMODIS, as well as to quantify their Seasonally Integrated Aboveground Net Primary Productivity, its trend, and Rain Use Efficiency, and relate them to seasonal integrated rainfall.
MATERIALS AND METHODS
Study area
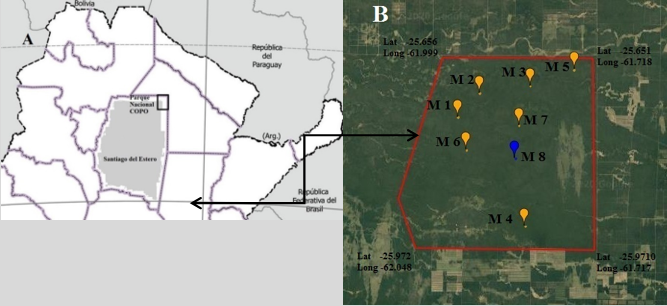
The study was conducted at Copo National Park (CNP) which has an area of 1,181 km2, and is located in Copo Department, northwest of the Province of Santiago del Estero, Argentina (Parques Nacionales, 2022) (Figure 1 A, B). According to the National Weather Service (2021), the rainy season starts in October (44.7 mm) and finishes in April (35.9 mm); the accumulated annual rainfall reaches 629 mm and its maximum values occur in January (134.8 mm). The average monthly temperature in January is 26.7 °C (summer) and 12.7 ° in July (winter).
Chaco Semi-arid Forest in CNP is xerophytic and open, it is considered the climax vegetation of the region (SAyDS, 2007). The study site represents the best preserved and most extensive tract of Chaco Forest in Argentina (Tálamo and Caziani, 2003). The landscape is flat (nearly horizontal) and homogeneous, with no surface water bodies, and is vegetated by thorny, semi-deciduous forests dominated by Schinopsis quebracho-colorado, Aspidosperma quebracho-blanco and Ziziphus mistol, which reach heights of 18m to 20 m. The dense stratum of 1-6m tall shrubs is dominated by Capparis retusa, Acacia praecox, Celtis pallida, Achatocarpus praecox and Schinus polygamus (Tálamo and Caziani, 2003; Talamo et al., 2012), among others. Broadleaves and herbaceous predominate in the lower strata (SAyDS, 2007).
MODIS NDVI Time Series
The time series of the Normalized Difference Vegetation Index (NDVI) (Rouse et al., 1973), it was derived from the Temporary Vegetation Analysis System (available on the http://www.satveg.cnptia.embrapa.br/satveg/). The system provides NDVI time series profiles (derived from MOD13Q1 (satellite Terra) and MYD13Q1 (satellite Aqua) images belonging to the LP-DAAC/EOS-NASA project, with Google Maps interface. MODIS NDVI, produced on 16-day intervals and at spatial resolution 250m x 250m, derived from atmospherically-corrected reflectance in the red, near-infrared, and blue wavebands. The VI's use a MODIS-specific compositing method based on product quality assurance metrics to remove low quality pixels.
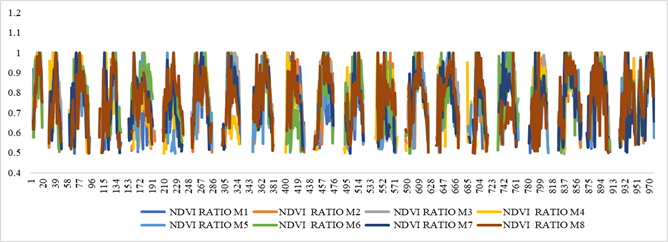
Eight time series of original NDVIMODIS were derived, one for each sampling point, and each time series ranged from 12.08.2000 to 26.06.2022 consisting in total 970 NDVI values for each sampling point (Figure 1 B and Figure 2).
Chaco semi-arid forest sampling points
The number of the forest samples (n = 8 pixels) was determined by the Fitzpatrick-Lins methodology (1981). Sampling points were located by simple random sampling with Idrisi TerrSet 2020sample module (Figure 1 B). Covers that did not correspond to FCHS were masked with binary masks monitored with high-resolution images available on Earth Observing System landviewer (2022).
Each sampling point is a NDVIMODIS covering 5.4 pure hectares of CNP Chaco Forest throughout the period analyzed. The Lat/Long coordinates of the sampling points are: M1 (Lat -25.757; Long -61,967); M2 (Lat -25,718; Long -61,926); M3 (Lat -25,706; Long -61,833); M4 (Lat 25,937; Long -61,844); M5 (Lat -25,678; Long -61,752); M6 (Lat -25,811; Long -61,951); M7 (Lat -25,771; Long -61,854) and M8 (Lat -25,825; Long -61,862) (Figure 1 B).
Chaco semi-arid forest growing seasons
The FCHS growing seasons (GS) were delimited by transforming the original NDVI time series into NDVIRATIO time series (Figure 2); the method it was developed by White et al. (1997) and was performed using equation 1.
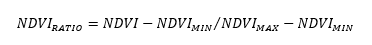 (1)
(1)The NDVIRATIO oscillates in the range of zero to one. In equation 1, NDVI is the 16 day NDVIMODIS, NDVIMAX is the maximum 16 day NDVIMODIS and NDVIMIN is the minimum 16 day NDVIMODIS. The beginning and end of each biannual growing season were determined by the NDVIRATIO 0.5 threshold (White et al., 1997) (Figure 2). According to Myneni and Williams (1994), the NDVIRATIO 0.50 threshold minimizes background effects on fAPAR/NDVIRATIO.
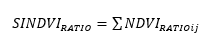
NDVIRATIO 0.50 threshold enabled the definition of the FCHS growing season (GS) of the entire period by removing values less than 0.5 NDVI from the time series. They corresponded to the NDVIRATIO of the months of June, July, August and September (dry season). NDVIRATIO of each growing season and sample point was integrated to generate Seasonally Integrated NDVIRATIO (SI-NDVIRATIO) (Equation 3) (Zhang et al., 2018; Zhang et al., 2020).
Aboveground Net Primary Productivity
Aboveground Net Primary Productivity (ANPP) of the FCHS was determined by the radiation use efficiency model proposed by Monteith (1972). The model ascertains that the ANPP of a plant cover is proportional to the incident photosynthetically active radiation (PAR), that is, to the fraction of that radiation intercepted by green tissues (fAPAR), and to the conversion efficiency (ε). According to Fensholt (2004), due to the strong relationship between NDVI and fAPAR, the Monteith model can be written as follows (Equation 2):
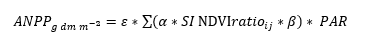 (2)
(2)In equation 2, the efficient use of the energy (ε) was determined by Ruimy et al. (1994) for dry forest ε = 0.50 g DM. Mj-1 m2. SI-NDVIRATIO is the NDVIRATIO growing season integrated, defined by the area under the curve delimited by start and end of the season, was determined mean (equation 3) (Zhang et al., 2018; Zhang et al., 2020).
 (3)
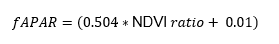
(3)The fraction of photosynthetically active radiation (fAPAR) absorbed by the Semi-arid Chaco Forest was determined by equation 4 (Seaquist et al., 2003). The parameters α = 0.504 and β = 0.01 are the constants that arise from the linear relationship between NDVIRATIO Maximum (0.996) and NDVIRATIO Minimum (0.50) of the 2000-2022 time series (Myneni & Williams 1994, Fensholt 2004, Seaquist et al., 2003).
 (4)
(4)The average global seasonal incident radiation in the area under study (average of 22 years), was derived from the NASA Prediction of Worldwide Energy Resourse Project (NASA, 2021). Incident photosynthetically active radiation (PAR) in foliage is considered to be a constant fraction of 48% of the incident radiation at the atmosphere limit (Seaquist et al., 2003, Fensholt, 2004). The ANPP of FCHS was quantified and expressed in kg DM. ha-1, for each GS and sampling point, starting from the seasonally integrated productivity (SI-ANPP) of the seasonally integrated NDVIRATIO (SI-NDVIRATIO) were quantified.
Rainfall data
Rainfall data for the period 2000-2022 were derived from the Weather Station of Sociedad Rural del Noreste Santiagueño (SRNS) (coordinates lat -27.65; long -62.40). Rainfall produced in the months corresponding to the GS (October to May) were integrated to generate the integrated seasonal rainfall (SR) for each of the 22 growing seasons (Figure 2).
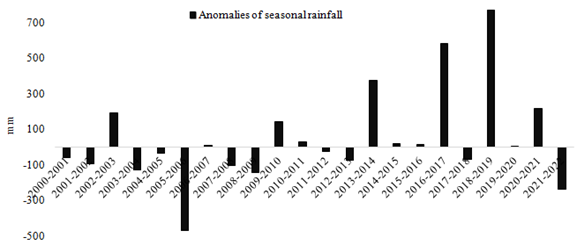
The anomalies of the seasonal rainfall were determined as follows (equation 5 and figure 3):
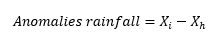 (5)
(5)where Xi is the integrated seasonal rainfall (SR) (2000-2022) and Xh is the historical integrated seasonal rainfall (1918-2022).
Rain use efficiency of Semiarid Chaco Forest
Rain use efficiency (RUE) could be a critical indicator for evaluating the response of primary productivity to variability of rainfall in arid and semi-arid ecosystems (Le Houérou et al., 1988; Sala et al., 1988). The RUE was determined by equation 6 (Bai et al., 2008; Zhang et al., 2020):
 (6)
(6)where RUE is the rainfall use efficiency (kg DM. ha−1 mm−1), SI-ANPP is the seasonally integrated aboveground net primary productivity (kg DM. ha-1 season−1), and RS is the seasonal integrated rainfall (mm).
Statistical analysis
The SI-ANPP of FCHS (kg DM. ha-1 ·season−1) (expectations) were compared, using the t-test for independent samples (Di Rienzo et al., 2022). The classification variables (distributions) were two cluster: One with seasonal negative rainfall anomalies (AN) (Figure 3), which including: 2000-2001, 2001-2002, 2003-2004, 2005-2006, 2007-2008, 2008-2009, 2012-2013, 2014-2015, 2017-2018, 2021-2022, and another with seasonal positive rainfall anomalies (AP) (Figure 3) which including: 2002-2003, 2004-2005, 2006-2007, 2009-2010, 2010-2011, 2011-2012, 2013-2014, 2015-2016, 2016-2017, 2018-2019, 2019-2020, 2020-2021.
The RUE (kg·DM. ha−1·mm−1) (dependent variable y) by means of the linear or nonlinear regression method (α = 0.05) were related to integrated season rainfall (SR) (independent variable x). The models were based on two goodness-of-fit tests: 1) the best adjustment of the adjusted coefficient of determination (R2) and 2) by the lack of fit test which is an estimation regardless s2 of the model or pure error (Di Rienzo et al., 2022).
Analysis trend of SI-ANPP was performed using a linear best-fit regression line fitted to SI-ANPP of growing season of the period 2000-2022. The slope of the resulting best-fit line was tested using a t-test for a parameter to see if it was significantly different (p < 0.01) from a zero slope (Di Rienzo et al., 2022).
The analyses were performed with the Infostat package (Di Rienzo et al., 2022). Only the relationships found statistically significant (p < 0.05) will be displayed.
The geographic information system used was Idrisi TerrSet 2020.
RESULTS AND DISCUSSION
Growing season and integrated aboveground net primary productivity
The NDVIMODIS time series and the 0.5 NDVIRATIO thresholds make it possible to delimit the start and end of the growing stations for the FCHS with high efficiency. The growing stations comprised the NDVIRATIO integrated of October, November, December, January, February, March, April and May. According to Gao et al. (2020), NDVI time series analysis that considers seasonality has been tested with both low and medium spatial resolution images and is capable of detecting forest disturbances in historical time series. However, while Gao et al. (2020) report that remote sensing thresholds are currently still a challenge, the NDVIRATIO 0.5 threshold used in this study reduces uncertainty in delimiting growing seasons, and thus increases accuracy in quantifying seasonal ANPP of Chaco Semi-arid Forest at local and regional level. According to White et al. (1997) the transformation is attractive because it is consistent. Thus, a single NDVIRATIO threshold may be used, obviating the need to establish absolute NDVI thresholds or landcover-specific thresholds.
The results of this study are promising since the average SI-ANPP obtained for the entire period (twenty tow season) was 43741.49 kg DM. ha-1, (a minimum of 14294.88 kg DM. ha-1 and a maximum of 64938.18 kg DM. ha-1) and it is similar to the average obtained by Baccini et al. (2012). They determined an ANPP mean of Chaco forests of 49200 kg DM. ha-1 which varies between 28600 and 69800 kg DM. ha-1.
Significant differences were found between SI-ANPP of growing season with seasonal negative rainfall anomalies negative and seasonal positive rainfall anomalies (T = -3.49; p = 0.0006) (Table 1). The growing seasons with seasonal negative rainfall anomalies had an SI-ANPP mean of 41390.25 kg DM. ha-1, a minimum of 14294.88 kg DM. ha-1 and a maximum of 62563.00 kg DM. ha-1. In this sense, Phillips et al. (2009) used records from multiple long-term monitoring plots across Amazonia to assess forest responses to the intense 2005 drought. The authors determined forest lost biomass due to unusually intense dry season, and conclude that Amazon forests appear vulnerable to increasing moisture stress.
The growing seasons with seasonal positive rainfall anomalies had an SI-ANPP mean of 46092.74 kg DM. ha-1, minimum of 25684.06 kg DM. ha-1 and maximum of 64938.18 kg DM. ha-1. SI-ANPP mean values of the FCHS determined (Table 1) are higher than the ANPP values determined by Baldassini (2018) and Baldassini & Paruelo (2020), in the FCHS in Anta, Salta, Argentina, in a precipitation gradient, similar to that of the study area, which oscillates between 600 and 800 mm yr-1. The authors determined, respectively, that the average annual ANPP ranges from 10875 kg DM. ha-1 to 11414 kg DM. ha-1, and 11063 kg DM. ha-1 yr-1. According to Baldassini (2018) and Baldassini & Paruelo (2020), the FCHS in Anta, Salta, evidences processes of forest degradation due to unsustainable anthropic activities, specifically selective logging and overgrazing.
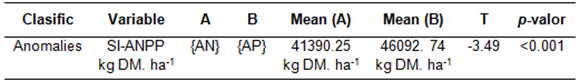
Cluster A = seasonal negative rainfall anomalies, Cluster B = seasonal positive rainfall anomalies, T = T-test statistic and p-valor = probability.
Rain use efficiency and seasonal integrated rainfall relationship
No significant relationships were found between la SI-ANPP and seasonal integrated rainfall (N = 22; R2 = 0.09; p> 0.05).
Significant and nonlinear relationships were found between rain use efficiency of forest systems and seasonal integrated rainfall (Figure 4): N = 22; R2 = 0.73; p = 0.0001. The model did not show a lack of fit. Seasonal integrated rainfall accounted for 73% of the variation of the RUE in FCHS CNP (Figure 4). According to Gamoun (2016), the RUE is also highly dependent on soil and vegetation type and environmental conditions and, therefore, may not necessarily respond linearly with rainfall. Furthermore, Hsu et al. (2012) state that, in many cases, ANPP during relatively wet years determines the nonlinearity of precipitation-ANPP relationship and the frequency of these “outlier” years is increasing with climate change.
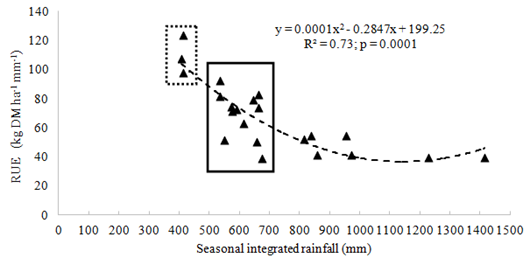
The RUE means of the twenty tow growing season of FCHS period 2000-2022 was 68 kg DM. ha-1 mm-1, being the maximum 124 kg DM. ha-1 mm-1 and the minimum 39 kg DM. ha-1 mm-1 (Figure 4).
The three growing season of forest system with respective maximum RUE (124, 108 and 98) had rainfall of the 400 mm (Figure 4, dash line). In this sense, Huxman et al. (2004) state that, at sites with the lowest annual average rainfall, high efficiency of water use associated with individual growth rate plant, is translated to water use high efficiency at the ecosystem level. Furthermore, Huxman et al. (2004), consider that there is convergence to a common maximum RUE that is typical of arid in years when water is most limiting, deserts, grasslands and forests all exhibit the same rate of biomass production per unit rainfall, despite differences in physiognomy and site-level RUE ecosystems.
The RUE of twelve growing season of FCHS oscillates between 39 kg DM. ha-1 mm-1 and 93 kg DM. ha-1 mm-1 all with rainfall ranging from 500 mm to 700 mm (normal rainfall for the study area) (Figure 4, solid line). Lower effectiveness of rain in growing season (RUE below average) with seasonal negative rainfall anomalies is consistent with higher evaporation losses (Noy-Meir, 1973). Increase in direct evaporation reduces ecosystem water use efficiency (lower PPN with the same precipitation) (Huxman et al. 2004; Newman et al. 2006). According to Noy Meir (1973) very common are drought-evading behavioral adaptations in which the plant uses stomatal control on productivity and water input so that both activities occur mostly (or exclusively) in season days, or hours of low transpiration.
In this sense, Reichstein et al. (2007) inferred a slight decrease of RUE during severe drought in European forests. Both authors, using remote sensing data from MODIS and AVHRR, indicate a strong negative anomaly of the fraction of absorbed photosynthetically active radiation in summer 2003, at more than five standard deviations of the previous years. Similar results were obtained by Zhang et al. (2014) who investigated the temporal patterns of NPP (MOD17) and RUE and their key driving climate factors, during the early 21st century drought for four biomes in China: Needleleaf forest, Broadleaf forest, Woody savannas, and Grassland. The authors supported that the RUE responded strongly to variations in current and previous year drought for all the four biomes.
The growing seasons of FCHS that had seasonal rainfall >700 mm, all with seasonal positive rainfall anomalies, are the ones that had the lowest RUE, which ranged between 40 kg DM. ha-1 mm-1 and 55 kg DM. ha-1 mm-1 (Figure 4). The widely accepted view is that RUE should increase with annual rainfall until other environmental factors limit ANPP (Le Houérou, 1984). They are major determinants of soil water availability; consequently, large amounts of rainfall, according to Noy-Meir (1973) ''ineffective precipitation'', are not utilized for plant growth, and have important effects on the site-level RUE (Noy-Meir, 1973; Le Houérou, 1984; Sala et al., 1988). Moreover, increases in annual rainfall amounts usually reduce RUE due to runoff and drainage (Bai et al., 2008; Vermeire et al., 2009; Dardel et al., 2014, Zhang et al., 2014; Gamoun, 2016; Zhang et al., 2018; Zhang et al., 2020; Li et al., 2020). In this sense, Paruelo et al. (1999), hypothesized that vegetation constraints decrease and biogeochemical constraints increase along a mean annual rainfall gradient. Thus, at each site, a combination of vegetation and biogeochemical constraints define a boundary within which ANPP varies in response to changes in water availability.
The results are consistent with the loss of large amounts of water by surface runoff when surpassing the threshold (boundary) of seasonal rainfall >700 mm and it would be related to geomorphology and climatic forces. Copo National Park is completely included in the sub-region of the paleo-causes or paleo-spillage of the Salado-Juramento rivers (Morello and Adamoli, 1974), an area that was shaped by ancient fluvial processes, where the forests grow on inter-fluvial homogeneous soil that occupies above 90% of the total area (Tálamo and Caziani, 2003, Talamo et al., 2012). It is a large silt-sandy plain, crossed by inactive dry channels filled with a finer sedimentation of sand. The soil profile is slightly concave with underground-type drainage with predominantly laminar runoff (Talamo et al., 2012). In rainy seasons, the water flows from high areas to lower areas or depressions; moreover, the presence of alluvial mini-fans (10-20 m) contributes to the formation of this drainage model (Caziani et al., 2003; Talamo et al., 2012).
In relation to climatic forces, and according to Noy-Meir (1973), Huxman et al. (2004), Vermeire et al. (2009), Hsu et al. (2012), Robinson et al. (2013), and Zhang et al. (2018), shifts in seasonal rainfall in intensity/magnitude, timing, frequency, and spatial and temporal variation of rainfall (persistent and random at all scales), which may independently affect communities, it will make it more important than ever to monitor how abiotic and biotic factors affect the transition from rainfall to plant-available soil moisture. In this sense, Figure 3 shows extreme seasonal positive anomalies of 500 mm and 700 mm. Further, in the period analyzed, average rainfall was recorded in the wettest quarter of great intensity/magnitude: October 63 mm (maximum 215 mm), November 92 mm (maximum 240 mm), December 127 mm (maximum 277 mm), January 130 mm (maximum 341 mm), February 99 mm (maximum 348 mm), March 93 mm (maximum 245 mm), April 69 mm (maximum 248 mm) and May 33 mm (maximum 290 mm).
Trends in seasonal integrated aboveground net primary productivity
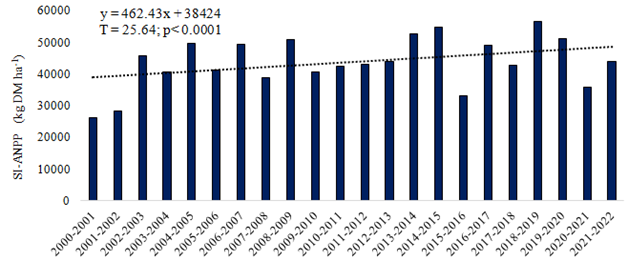
The need for information on forest ANPP goes beyond that of REDD+, with countries wanting effective strategies to monitor the state of their forest resources (FAO, 2020). In this sense, the SI-ANPP of FCHS CNP showed a large positive trend in the period 2000-2022 (slope = 462.43; T = 25.64 p <0.0001) (Figure 5).
The stability of SI-ANPP of FCHS CNP throughout the period is due to two factors: the first and most important is the fundamental creation of legally established protected areas, such as national parks, for the preservation of the forest system from unsustainable anthropic activities (deforestation and degradation due to illegal extraction of high-value species), and the second and as a natural consequence of the first, the predominance of woody species of deep roots (Reichstein & Carvalhais, 2019) and the strategic displacements of its lower strata phenophases (broadleaves and herbaceous) in drought times (Noy-Meir, 1973; Reichstein & Carvalhais, 2019, Gavinet et al., 2019). Le Houérou (1984) states that the high level of synchronization between biomass productivity and the positive and negative trends of rainfall are due to the wide adaptation of plants to water-limited environments.
The stabilizing effect of species diversity results from the fact that different coexisting species are complementary in their responses to environmental fluctuations. Natural ecosystems display a range of adaptive responses to environmental changes differential reproduction of genotypes, and changes in species abundances (Lekevičius & Loreau, 2012), including differential gene activity and phenotypic plasticity.
Improved knowledge on the response to the seasonal variability of rainfall of Chaco Semi-arid Forest in Copo National Park is thus crucial to better interpret the consequences of climate predictions of an altered global hydrological cycle and to implement appropriate adaptation measures to climate change in arid and semiarid lands similar to the study area.
CONCLUSIONS
The NDVIMODIS time series and the 0.5 NDVIRATIO thresholds make it possible to delimit the growth season and quantify the ANPP of Chaco Semi-arid Forest with high efficiency in the study area.
Information derived from time series is essential for understanding the temporal dynamics and productive capacity of forest systems in Copo National Park.
The nonlinear regression model obtained provides unedited information at the local level on the efficiency of the SI-ANPP of the FCHS CNP in terms of the seasonal rainfall. The SI-ANPP FCHS CNP appears vulnerable to negative anomalies of seasonal rainfalls.
Seasonal rainfall >700 mm could be considered a threshold in the efficient water use of FCHS.
The large positive trend of SI-ANPP of the FCHS CNP in the period 2000-2022, evidenced the high stability of the forest system.
The results obtained reaffirm the importance of the creation of legally protected areas as national parks for the preservation of forest systems in the region.
Acknowledgments
To the Temporal-Vegetation Analysis System of the Space Research Institute /dsr.inpe.br/laf/series/. To the LP-DAAC/EOS-NASA Project.
To the NASA Prediction of Worldwide Energy Resource Project- https://power.larc.nasa.gov/.
To Sociedad Rural del Noreste Santiagueño (Mr. Silvio Vicente) for his contribution on rainfall data- sociedadruralquimili@hotmail.com
REFERENCES
Baccini, A.G.S.J., Goetz, S.J., Walker, W.S., Laporte, N.T., Sun, M., Sulla-Menashe, D., ... y Houghton, R. (2012). Estimated carbon dioxide emissions from tropical deforestation improved by carbon-density maps. Nature Climate Change, 2(3), 182-185. DOI: 10.1038/NCLIMATE1354
Bai Y., Wu J., Xing Q., Pan Q., Huang J., Yang D. y Han X. (2008). Primary production and rain use efficiency across a precipitation gradient on the Mongolia plateau. Ecology, 89(8), 2140–2153. https://doi.org/10.1890/07-0992.1
Baldassini, P. y Paruelo, J. (2020). Sistemas agrícolas y silvopastoriles en el Chaco Semiárido. Impactos sobre la productividad primaria. Ecología Austral 30:045-062. DOI: 10.25260/EA.20.30.1.0.961
Baldassini, P. (2018). Provisión de Servicios Ecosistémicos en el Chaco Semiárido: efectos de los cambios en el uso del suelo y la variabilidad climática sobre la dinámica del carbono. Tesis Doctoral, IFEVA, Facultad de Agronomía, Universidad de Buenos Aires, 214p. Available on https://ri.conicet.gov.ar/bitstream/handle/11336/81496/CONICET_Digital_Nro.898fb259-8039-4e6a-9298-e00fb83efd3e_A.pdf;jsessionid=88D233C8DC721BE344A7202A4ADD3067?sequence=2
Caziani, S.M., Trucco, C.E., Perovic, P.G., Tálamo, A., Derlindati, E., et al. (2003). Línea de base y programa de monitoreo de la biodiversidad del Parque Nacional Copo. Proyecto de Conservación de la Biodiversidad. Donación GEF/BIRF/APN TF 028372-AR.
Dardel, C., Kergoat, L., Hiernaux, P., Grippa, M., Mougin, E., Ciais, P. y Nguyen, C.C. (2014). Rain-Use-Efficiency: What it Tells us about the Conflicting Sahel Greening and Sahelian Paradox. Remote Sens 6:3446-3474 DOI:10.3390/rs6043446
Di Rienzo, J.A, Casanoves, F., Balzarini, M.G, González, L. (2022). Manual del Usuario. Grupo InfoStat, FCA, Universidad Nacional de Córdoba, Argentina. Available on https://www.researchgate.net/publication/319875201
Earth Observing System Project (2022). Image derived from Sensor Sentinel-2 L2A. Available on https://eos.com/landviewer
FAO (Food and Agriculture Organization). (2020). El estado de los bosques del mundo. Organización de las Naciones Unidas para la Alimentación y la Agricultura, Roma. Available on http://www.fao.org/3/ca8642es/CA8642ES.pdf
Fensholt, R. (2004). Assessment of primary production in a semi-arid environment from satellite data - exploiting capabilities of new sensors. Ph.D. thesis. Museum Tusculanum. 253 p.
Fitzpatrick-Lins, K. (1981). Comparison of Sampling Procedures and Data Análisis for a Land-use and land-cover map. Photogrammetric Engineering & Remote Sensing, 47:343-351. Available on https://www.asprs.org/wp-content/uploads/pers/1981journal/mar/1981_mar_343-351.pdf
Gamoun, M. (2016). Rain use efficiency, primary production and rainfall relationships in desert rangelands of Tunisia. Land Degrad. Develop., 27, 738–747 DOI: 10.1002/ldr.2418.
Gao, Y., Skutsch, M., Paneque-G´alvez, J. y Ghilardi, A. (2020). Remote sensing of forest degradation: a review. Environ. Res. Lett. 15, 103001. Available on https://iopscience.iop.org/article/10.1088/1748-9326/abaad7/pdf
Gavinet, J., Ourcival, J.M, y Limousin, J.M. (2019). Rainfall exclusion and thinning can alter the relationships between forest functioning and drought. New Phytologist, 223,1267–1279.
Hsu, J.S, Powell, J. y Adler, P.B. (2012). Sensitivity of mean annual primary production to rainfall. Global Change Biology, 18, 2246–2255. Available on https://onlinelibrary.wiley.com/doi/abs/10.1111/j.1365-2486.2012.02687.x
Huxman, T.E., Smith, M.D., Fay, P.A., Knapp, A.K., Shaw, M.R., Loik, M.E., ... & Williams, D.G. (2004). Convergence across biomes to a common rain-use efficiency. Nature, 429 (6992), 651–654 DOI.org/10.1038/nature02561
Instituto Geográfico Nacional. (2022). Argenmaps. Available on https://mapa.ign.gob.ar/
Kumar, L. y Mutanga, O. (2017). Remote Sensing of Above-Ground Biomass. Remote Sens. 9, 935. Disponible en: https://www.mdpi.com/2072-4292/9/9/935
Li, Y., Li, M., Li, C. y Liu, Z. (2020). Forest aboveground biomass estimation using Landsat 8 and Sentinel-1A data with machine learning algorithms. Scientific Reports, 10, 9952 DOI.org/10.1038/s41598-020-67024-3
Le Houerou, H.N. (1984). Rain use efficiency: a unising concept in aridland ecology. Journal of Arid Environments, 7, 213-247.
Le Houerou, H.N., Bingham, R.L. y Skerbek, W. (1988). Relationship between the variability of primary production and the variability of annual precipitation in world arid lands. Journal of Arid Environments, 15, 1-18.
Lekevičius, E. y Loreau, M. (2012). Adaptability and functional stability in forest ecosystems: a hierarchical conceptual framework. EKOLOGIJA, 58, 391–404 https://liuwww.researchgate.net/publication/236514647
Monteith, J.L. (1972). Solar radiation and productivity in tropical ecosystems. Journal of Applied Ecology, 9, 747-766. https://doi.org/10.2307/2401901.
Morello, J. y Adamoli, J. (1974). Las grandes unidades de vegetación y ambiente del Chaco argentino. Segunda Parte: Vegetación y ambiente de la Provincia del Chaco. INTA Serie Fitogeografica 13.
Myneni, R.B y Williams, D.L. (1994). On the Relationship between FAPAR and NDVI. Remote Sens. Environ. 49:200-211 DOI: https://doi.org/10.1016/0034-4257(94)90016-7
National Aeronautics and Space Administration (NASA). (2021). Prediction of Worldwide Energy Resource (POWER) Project. https://power.larc.nasa.gov/.
National Weather Service. 2021. Centro de Información Meteorológica, Servicios climáticos. https://www.smn.gob.ar/descarga-de-datos
Newman, B.D., Wilcox, B.P., Archer, S. R., Breshears, D.D., Dahm, C.N., Duffy, C. J., ... y Vivoni, E. R. (2006). Ecohydrology of water-limited environments: A scientific vision. Water Resources Research 42(6), doi:10.1029/2005WR004141
Noy-Meir, I. (1973). Desert ecosystems: environment and producers. Annual Review of Ecology and Systematics, 4, 25–51.
Parques Nacionales (2022). Ministerio de Ambiente y Desarrollo Sostenible. www.argentina.gob.ar/parquesnacionales
Paruelo, J.M., Lauenroth, W.K., Burke, I.C. y Sala, O.E. (1999). Grassland precipitation-use efficiency varies across a resource gradient. Ecosystems, 2, 64–68. DOI: 10.1007/s100219900058
Phillips, O.L., Aragão, L.E., Lewis, S.L., Fisher, J.B., Lloyd, J., López-González, G., ... & Torres-Lezama, A. (2009). Drought Sensitivity of the Amazon Rainforest. Science 323(5919), 1344-1347. DOI: 10.1126/science.1164033
Reichstein, M. y Carvalhais, N. (2019). Aspects of Forest Biomass in the Earth System: Its Role and Major Unknowns. Surveys in Geophysics, 40, 693–707. https://doi.org/10.1007/s10712-019-09551-x
Reichstein, M., Ciais, P., Papale, D., Valentini, R., Running, S., Viovy, N., ... & Zhao, M. (2007). Reduction of ecosystem productivity and respiration during the European summer 2003 climate anomaly: A joint flux tower, remote sensing and modelling analysis, Global Change Biol. 13(3), 634– 651 DOI: 10.1111/j.1365-2486.2006.01224.x
Robinson, T.M.P, La Pierre, K.J., Vadeboncoeur, M.A., Byrne, K. M., Thomey, M. L., & Colby, S. E. (2013). Seasonal, not annual precipitation drives community productivity across ecosystems. Oikos 122(5), 727–738 Available on n https://scholars.unh.edu/ersc/3/
Rouse, J.W., Haas, R.H., Schell, J.A., Deering, D.W. (1973). Monitoring vegetation systems in the Great plains with ERTS, Third RTS Symposium, NASA SP-351 I, 309-317. Available on https://ntrs.nasa.gov/citations/19740022614
Ruimy, A., Saugier, B., Dedieu, D. (1994). Methodology for the estimation of terrestrial net primary production from remotely sensed data. Journal of Geophysical Research, 99, 5263-5283. Available on https://www.researchgate.net/publication/237923026
Sala, O.E., Parton, W.J., Joyce, L.A. y Lauenroth, W.K. (1988). Primary production of the central grassland región of the United States. Ecology, 69, 40–45.
Secretaria de Ambiente y Desarrollo Sustentable de la Nación (SAyDS). (2007). Informe Regional Parque Chaqueño. En: Primer inventario nacional de bosques nativos, Proyecto Bosques Nativos y Áreas protegidas BIRF 4085-AR, Argentina, 114p. Available on https://www.argentina.gob.ar/sites/default/files/primer_inventario_nacional_-_informe_nacional_1.pdf
Seaquist, J.W, Olsson, L. y Ardö, J. (2003). A remote sensing-based primary production model for grassland biomes. Ecological Modelling, 169, 131–155 Available on https://scholar.google.se/citations?user=G0y0a1UAAAAJ&hl=en
Tálamo, A., Lopez de Casenave, J. y Caziani, S.M. (2012). Components of woody plant diversity in semi-arid Chaco forests with heterogeneous land use and disturbance histories. Journal of Arid Environments, 85, 79-85.
Talamo, A. & Caziani, S.M. (2003). Variation in woody vegetation among sites with different disturbance histories in the Argentine Chaco. For. Ecol. Manage, 184 (1–3), 79–92. https://doi.org/10.1016/S0378-1127(03)00150-6.
TerrSet 2020 Geospatial Monitoring and Modeling Software. (2022). Clark Labs, Clark University.
Vermeire, L.T., Heitschmidt, R.K. y Rinella, M.J. (2009). Primary Productivity and Precipitation-Use Efficiency in Mixed-Grass Prairie: A Comparison of Northern and Southern US Sites. Rangeland Ecol Manage, 62, 230–239 DOI.org/10.2111/07-140R2.1
White, M.A., Thomton, P.E. y Running, S.W. (1997). A continental phenology model for monitoring vegetation responses to interannual climatic variability. Global Biogeochemical Cycles, 11, 217-234. https://agupubs.onlinelibrary.wiley.com/doi/pdf/10.1029/97GB00330
Zhang T., Yu G., Chen Z., Hu Z., Jiao C., Yang, M., ... & Li, W. (2020). Patterns and controls of vegetation productivity and precipitation-use efficiency across Eurasian grasslands. Science of The Total Environment, 741, 140204, 1-9. DOI: 10.1016/j.scitotenv.2020.140204.
Zhang, W., Brandt, M., Tong, X., Tian, Q. y Fensholt, R. (2018). Impacts of the seasonal distribution of rainfall on vegetation productivity across the Sahel. Biogeosciences, 15, 319–330. Available on https://www.researchgate.net/publication/322510249
Zhang, X., Moran, S.M., Zhao, X., Liu, S., Zhou, T., Ponce-Campos, G. E., & Liu, F. (2014). Impact of prolonged drought on rainfall use efficiency using MODIS data across China in the early 21st century. Remote Sensing of Environment, 150, 188–197
Author notes
tiedemannjl@gmail.com

